- Cryptos trended lower last week, driven largely by risk-off sentiments on newly released Fed meeting notes and economic data.
- The Fed expressed caution around inflation, especially as Trump’s policies will kick in after his inauguration on Jan. 20.
- Meanwhile, spot crypto ETFs logged outflows from Wednesday, Jan. 8.
Bitcoin
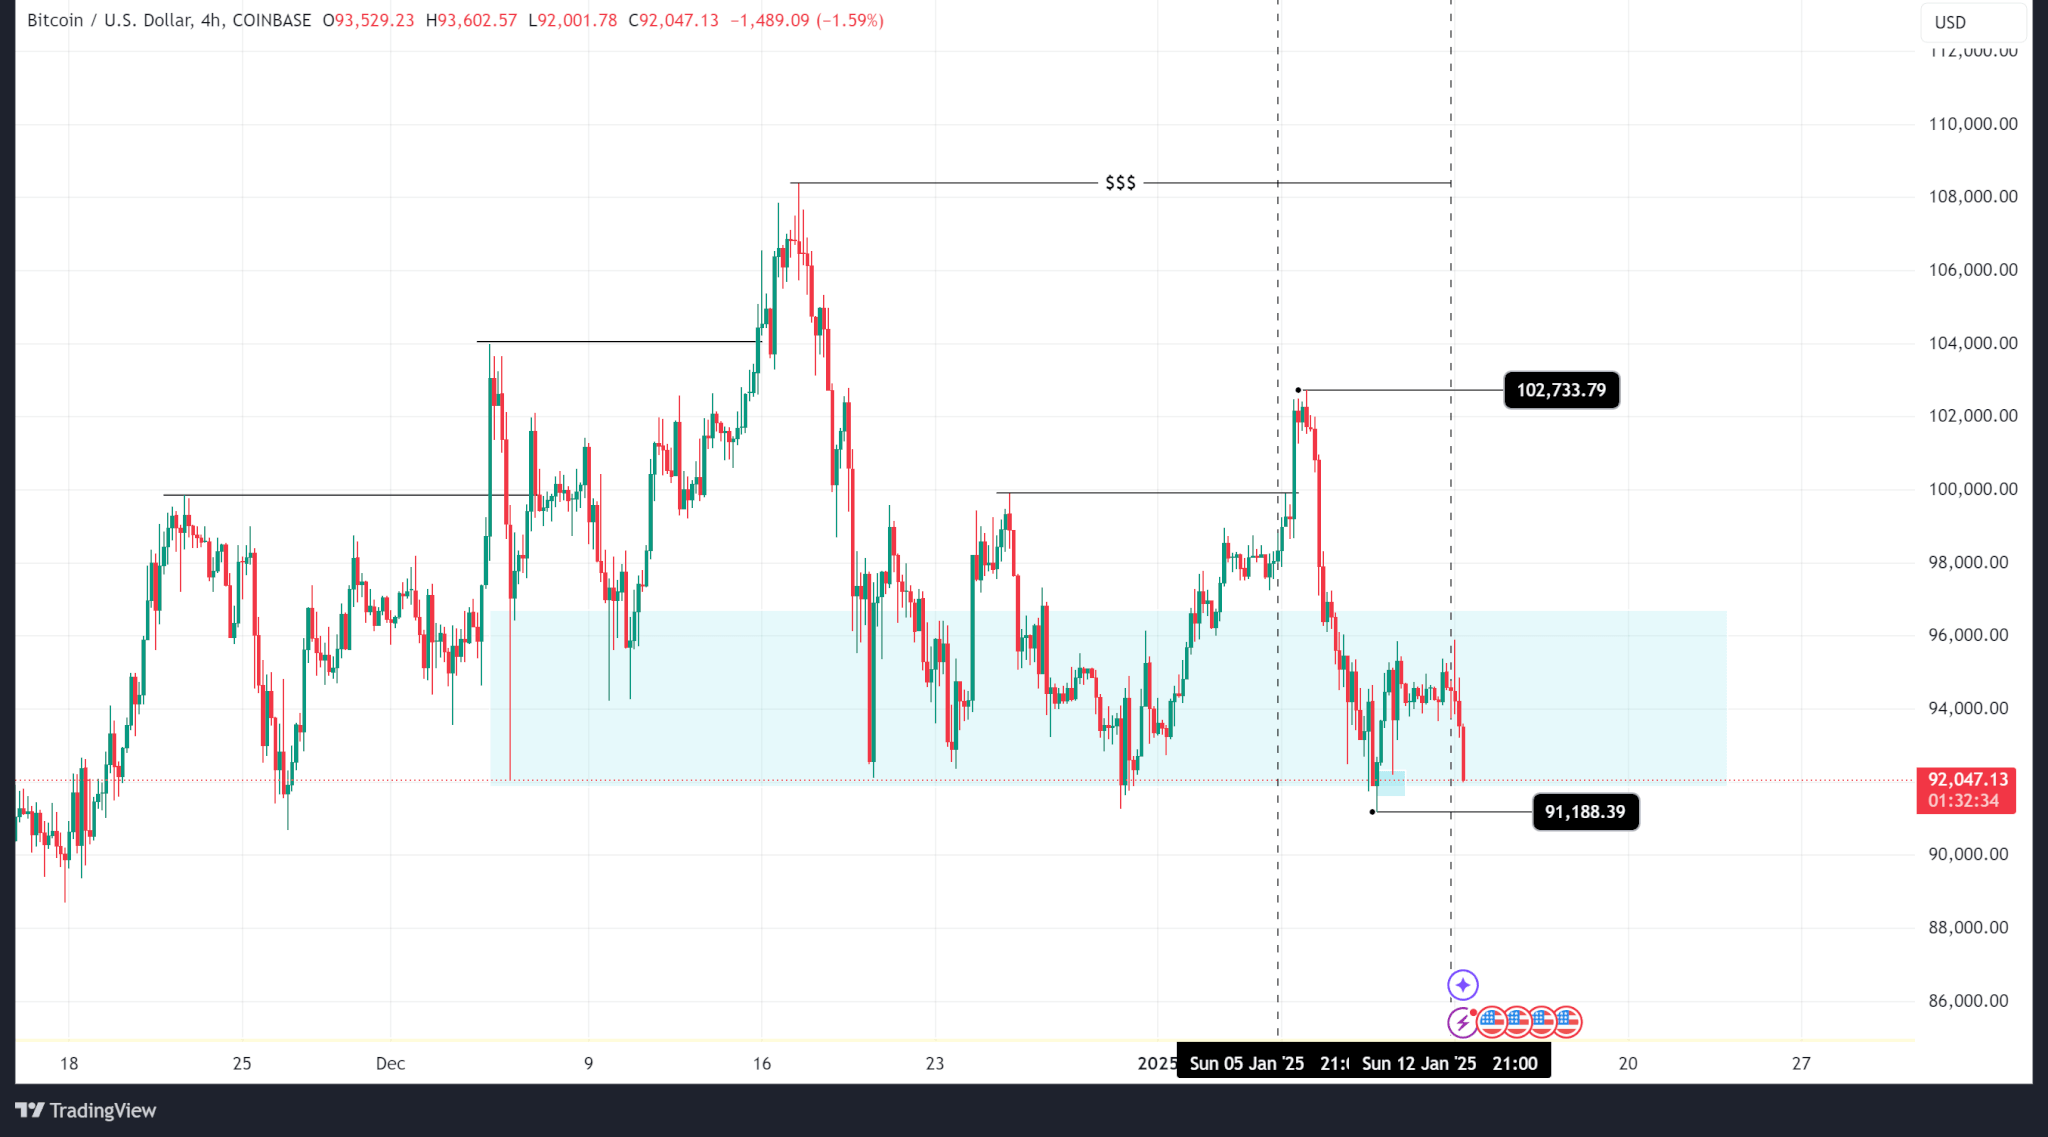
Bitcoin’s price logged a negative week falling from a high of $102,733 to a low of $91,188 before eventually closing at $94,547.
Technical analysis shows a break above the last lower high and a push back down into the H4 demand zone, which means that although the price took a bearish turn, it is still in overall bullish territory.
Much of this bearish sentiment is driven by bleak economic expectations. The Fed meeting minutes, released on Jan. 8, showed that the reserve bank is cautious about inflation it expects will follow Trump’s policies.
As such, the likelihood of continued rate cuts has dwindled, with some analysts seeing an end to cuts early this year. The market’s reaction reflects this updated risk-off sentiment.
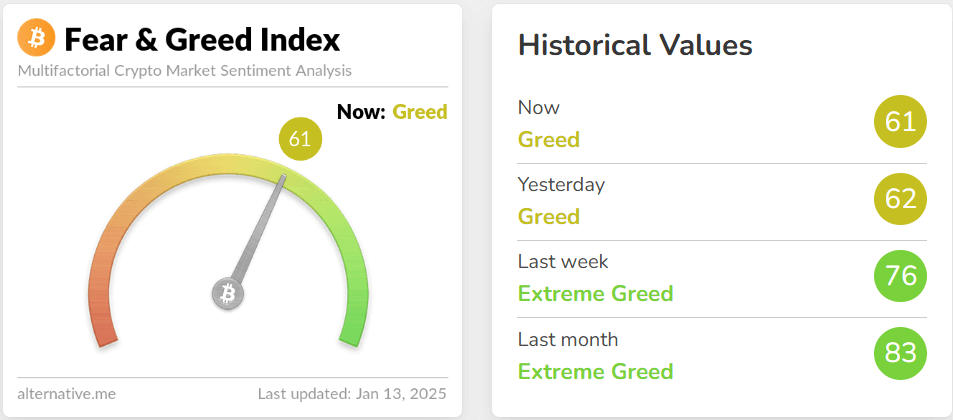
Bitcoin’s open interest chart shows a decline in open contracts between Wednesday and now. Open interest hit a weekly high on Tuesday at $18.16Bn on the CME, fell to a low on Thursday ($16.55Bn), and mellowed out the rest of the week.

Meanwhile, spot Bitcoin ETFs logged outflows after the release of the Fed’s meeting minutes on Wednesday. Outflows totalled $718.20Mn while inflows totalled $1.03Bn.
Outlook
Bitcoin’s price currently hovers around the bottom of the demand zone. If it breaks below, price could be pushed down to $85,100 where a fair value gap could act as support.
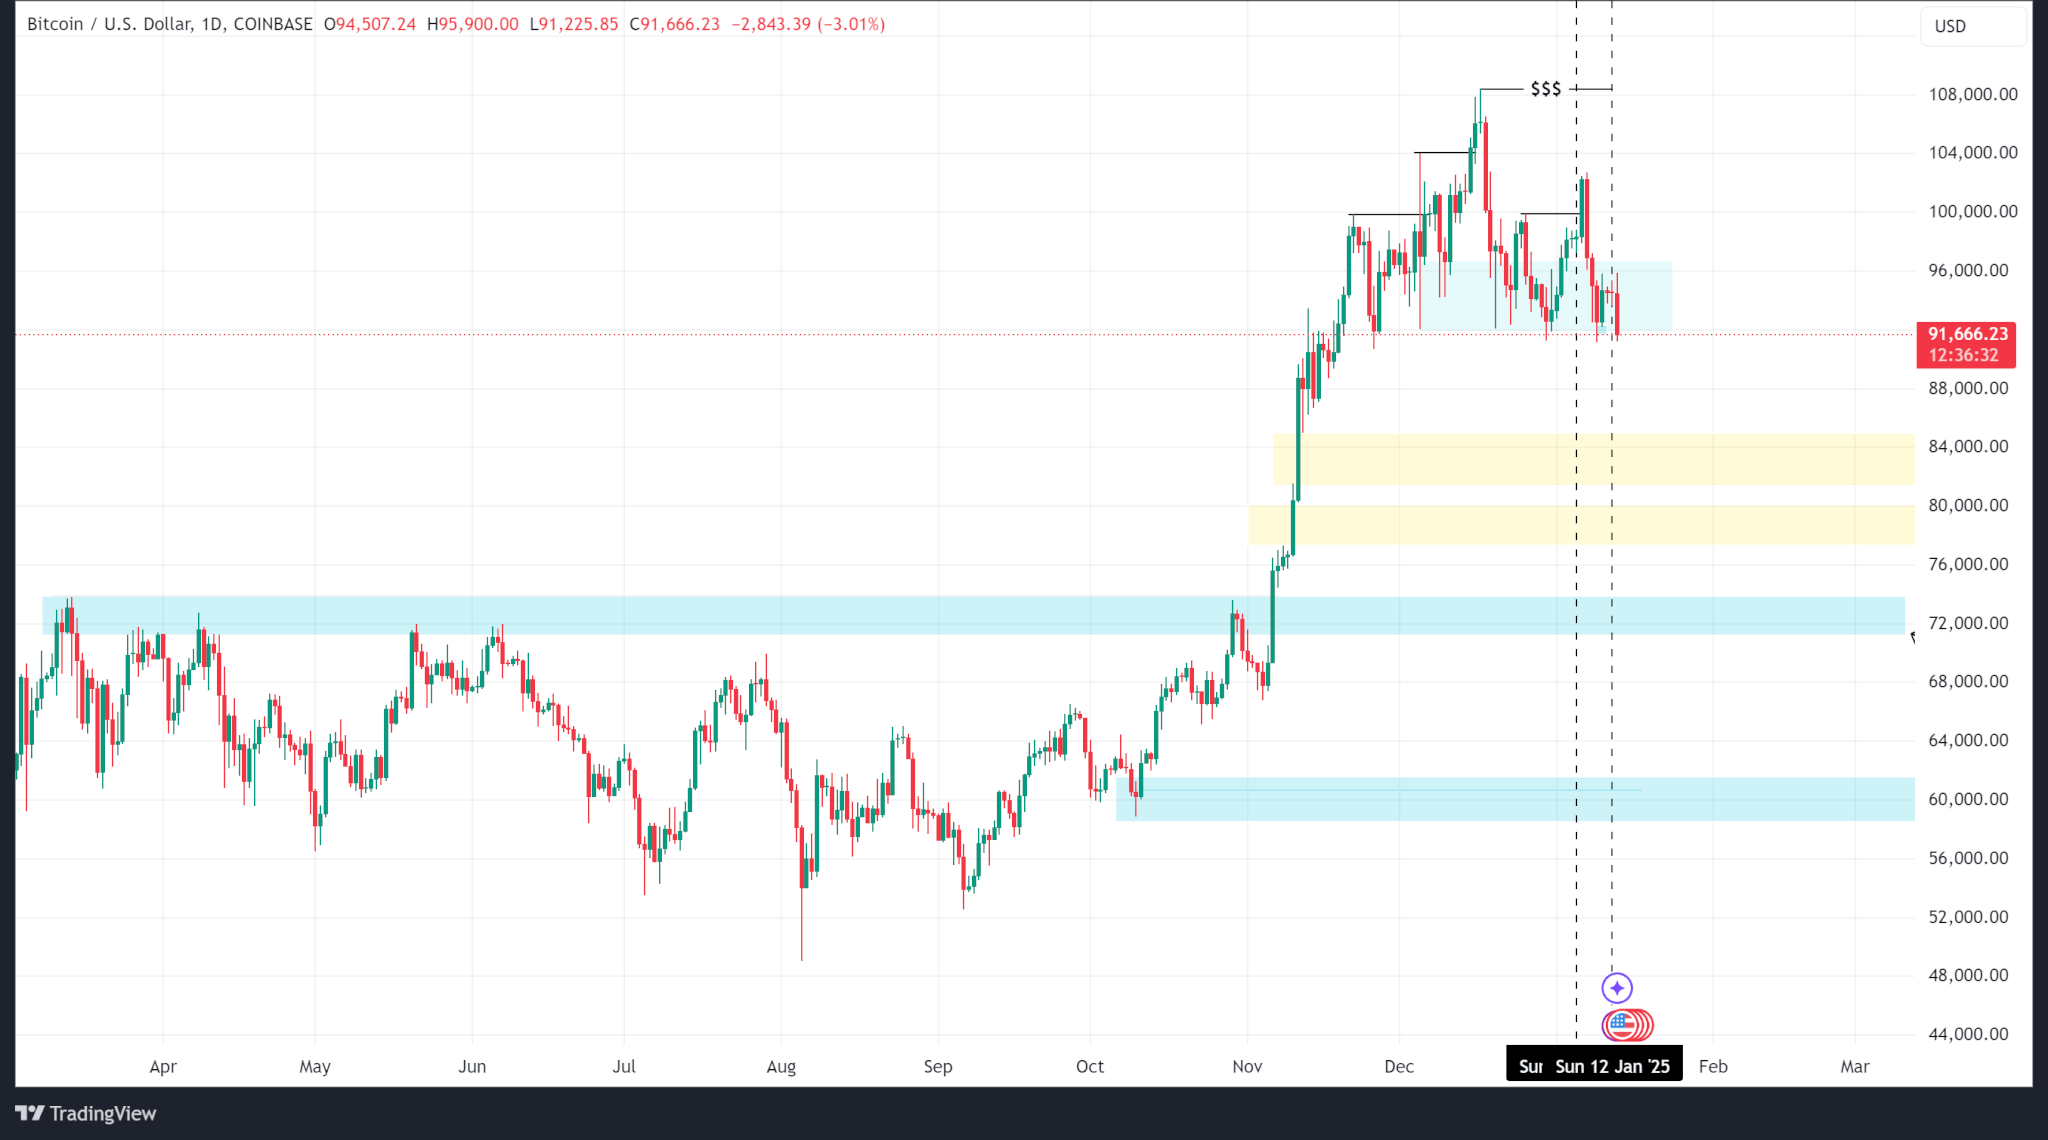
BTC trades at $91,622 as of publishing.
Ethereum
Ethereum’s price also logged a negative week, falling from a high of $3,744 to a low of $3,157 before closing at $3,236. ETH price action tested March 2024’s high of $4,089 in early Dec 2024 but failed to break above and has been logging lower lows since.
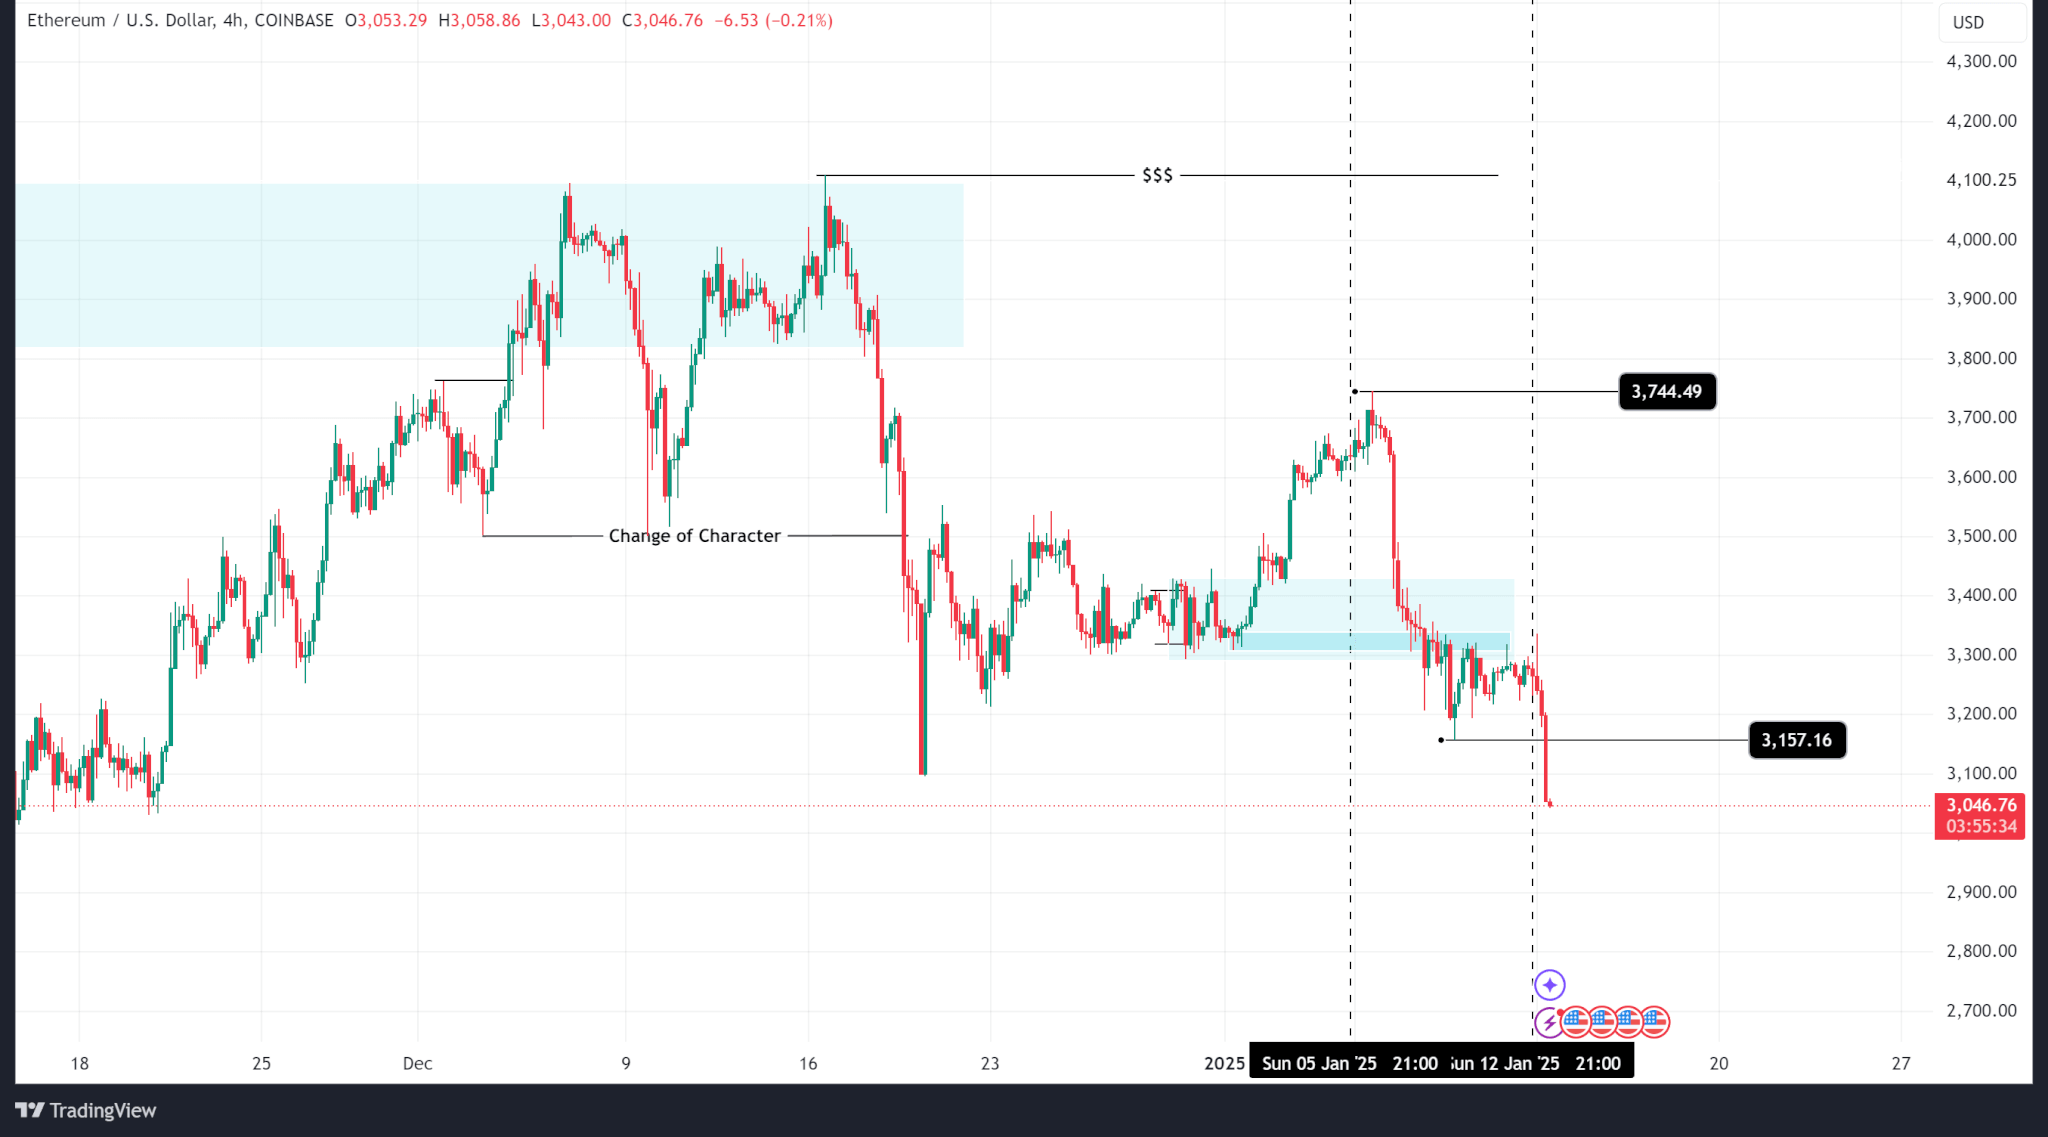
Open interest dropped from a Jan. 7 high of $3.50Bn and continued to decline until it was $2.63Bn as of this publication.

Meanwhile, Ethereum spot ETFs logged a weekly net outflow of $186.00Mn following risk-off sentiments in the market.
Outlook
As Ethereum’s price continues to trend lower, the next technical level that could provide support is the fair value gap at the $2,893 price level.
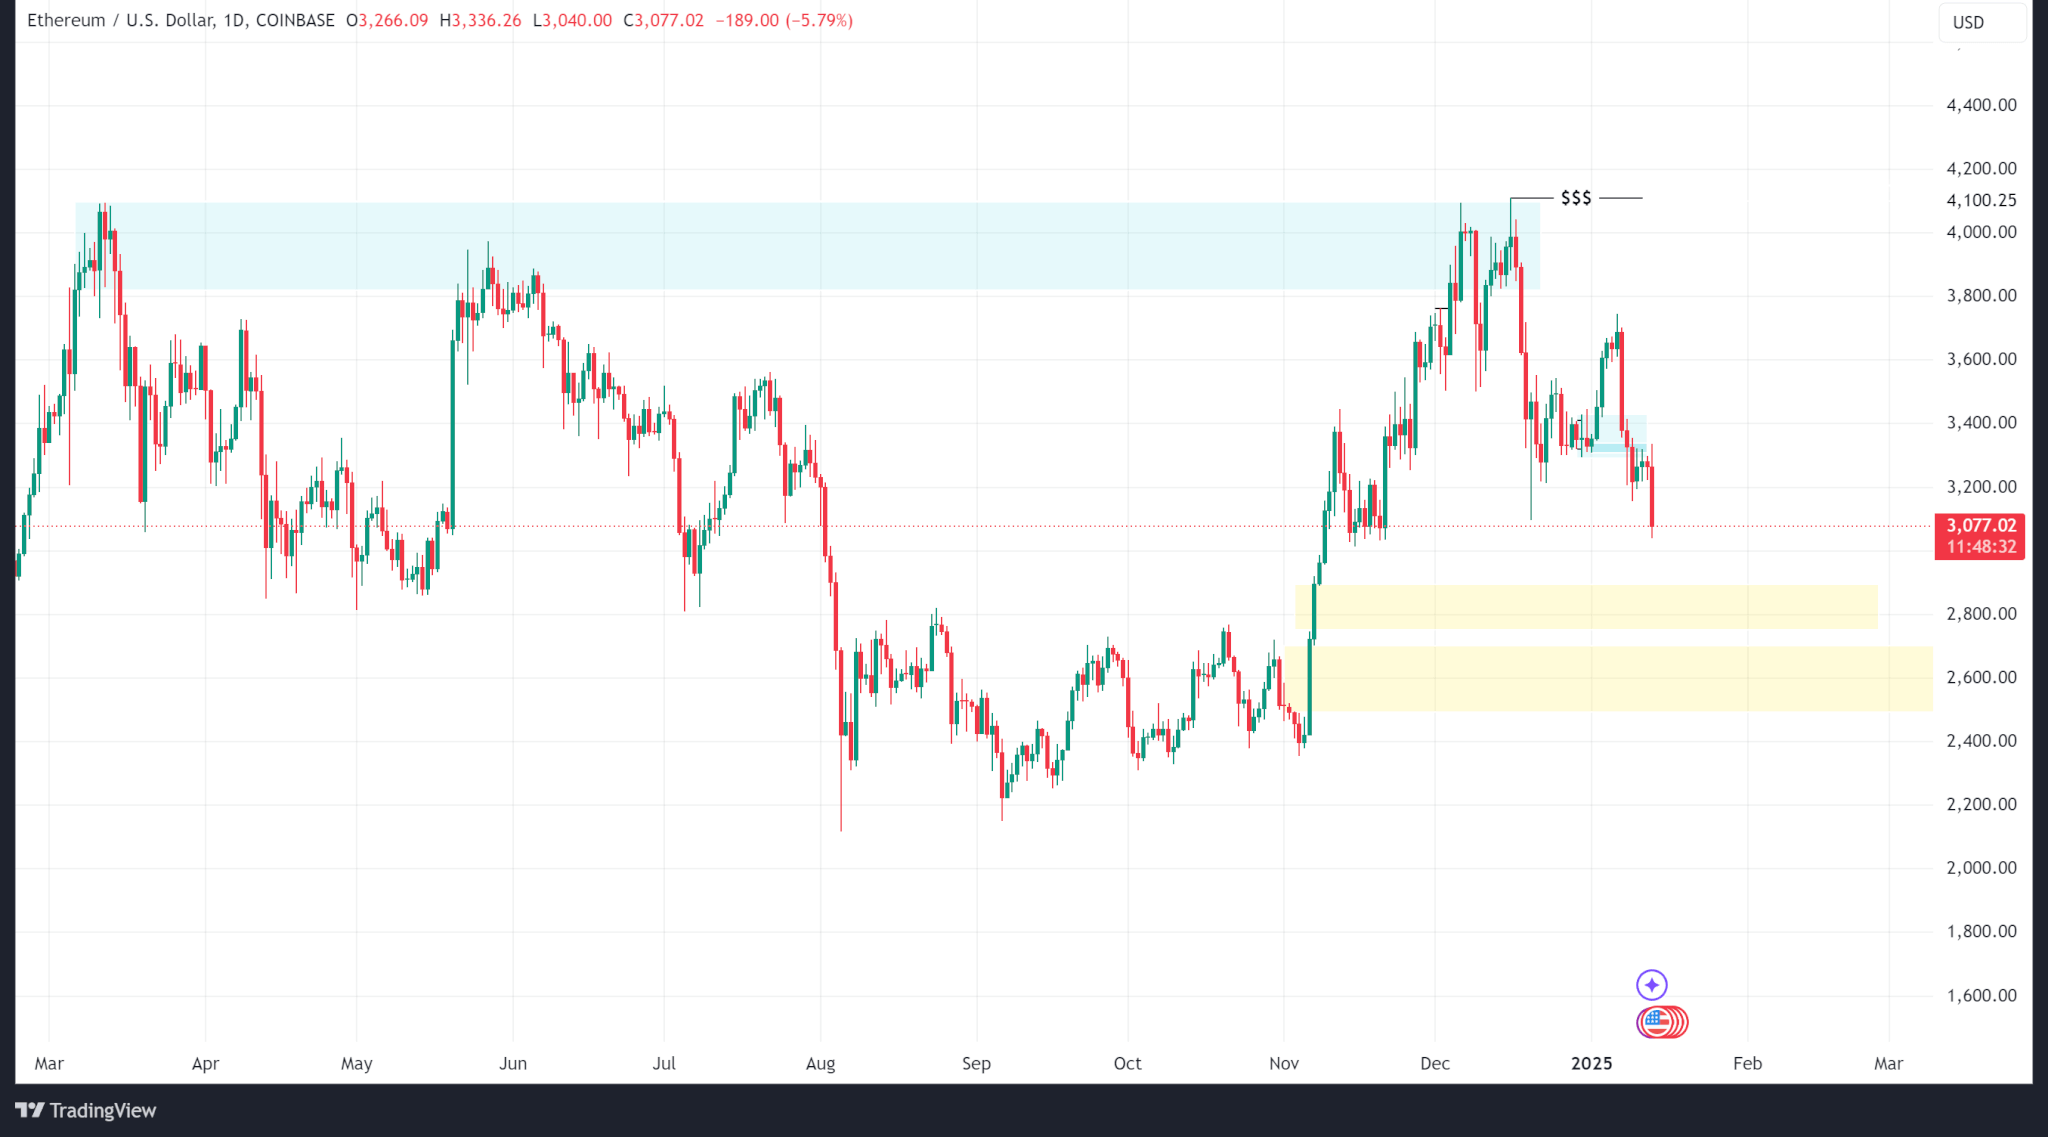
ETH trades at $3,071 as of publishing.
Solana
Solana’s price fell from a weekly high of $223 to a weekly low of $181 before eventually closing at $188, logging a total loss of 12.53%. SOL continues to trend lower after failing to close above its all-time high of $260.
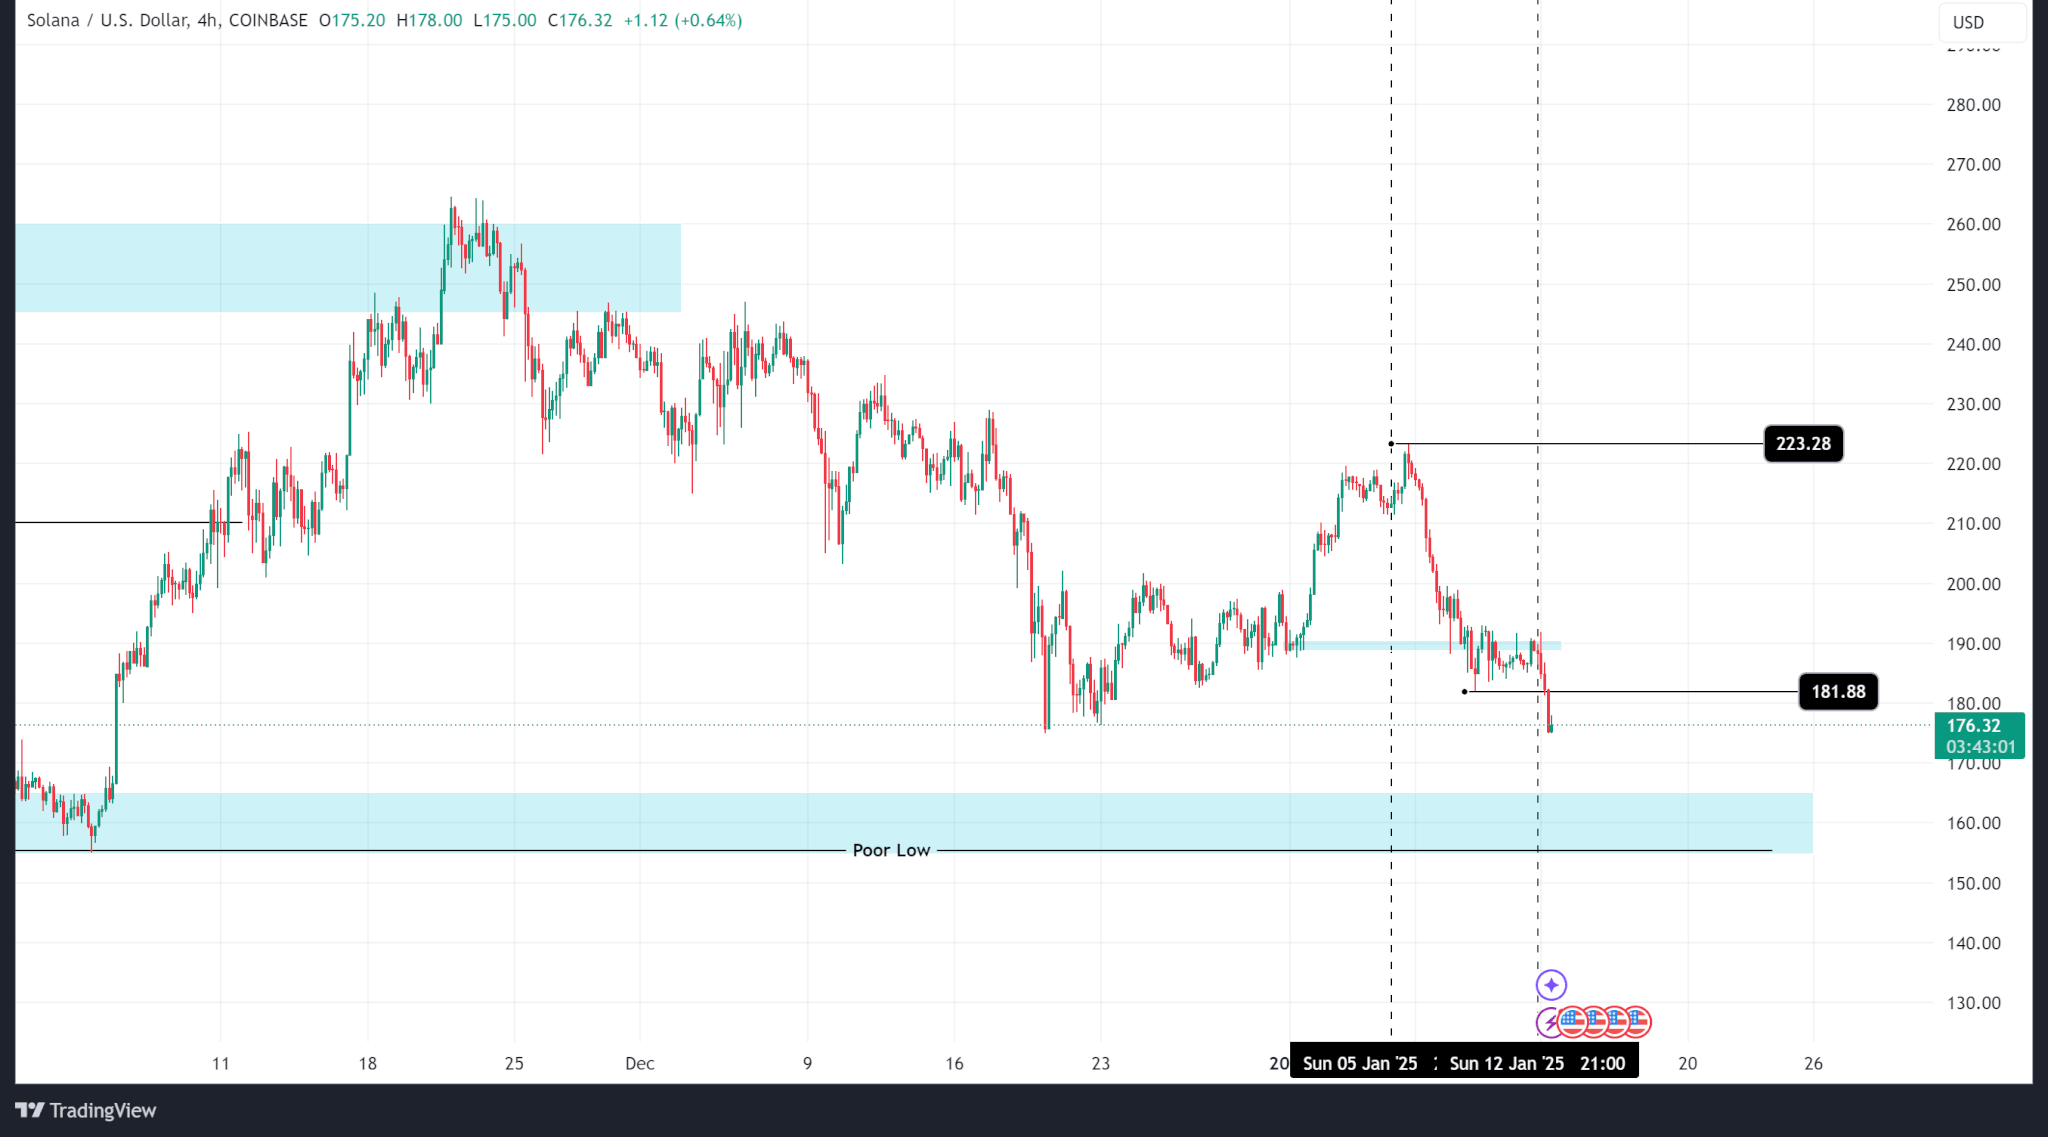
Open interest data shows a steep fall from $1.89Bn on Binance on Jan. 7 to $1.58Bn on Jan. 10. As of this publication, OI levels have improved to $1.63Bn.

Outlook
The next technical support zone is at the $164 price level. However, although the order block is a support, it is a poor low that could be taken out even if price reverses from that zone.
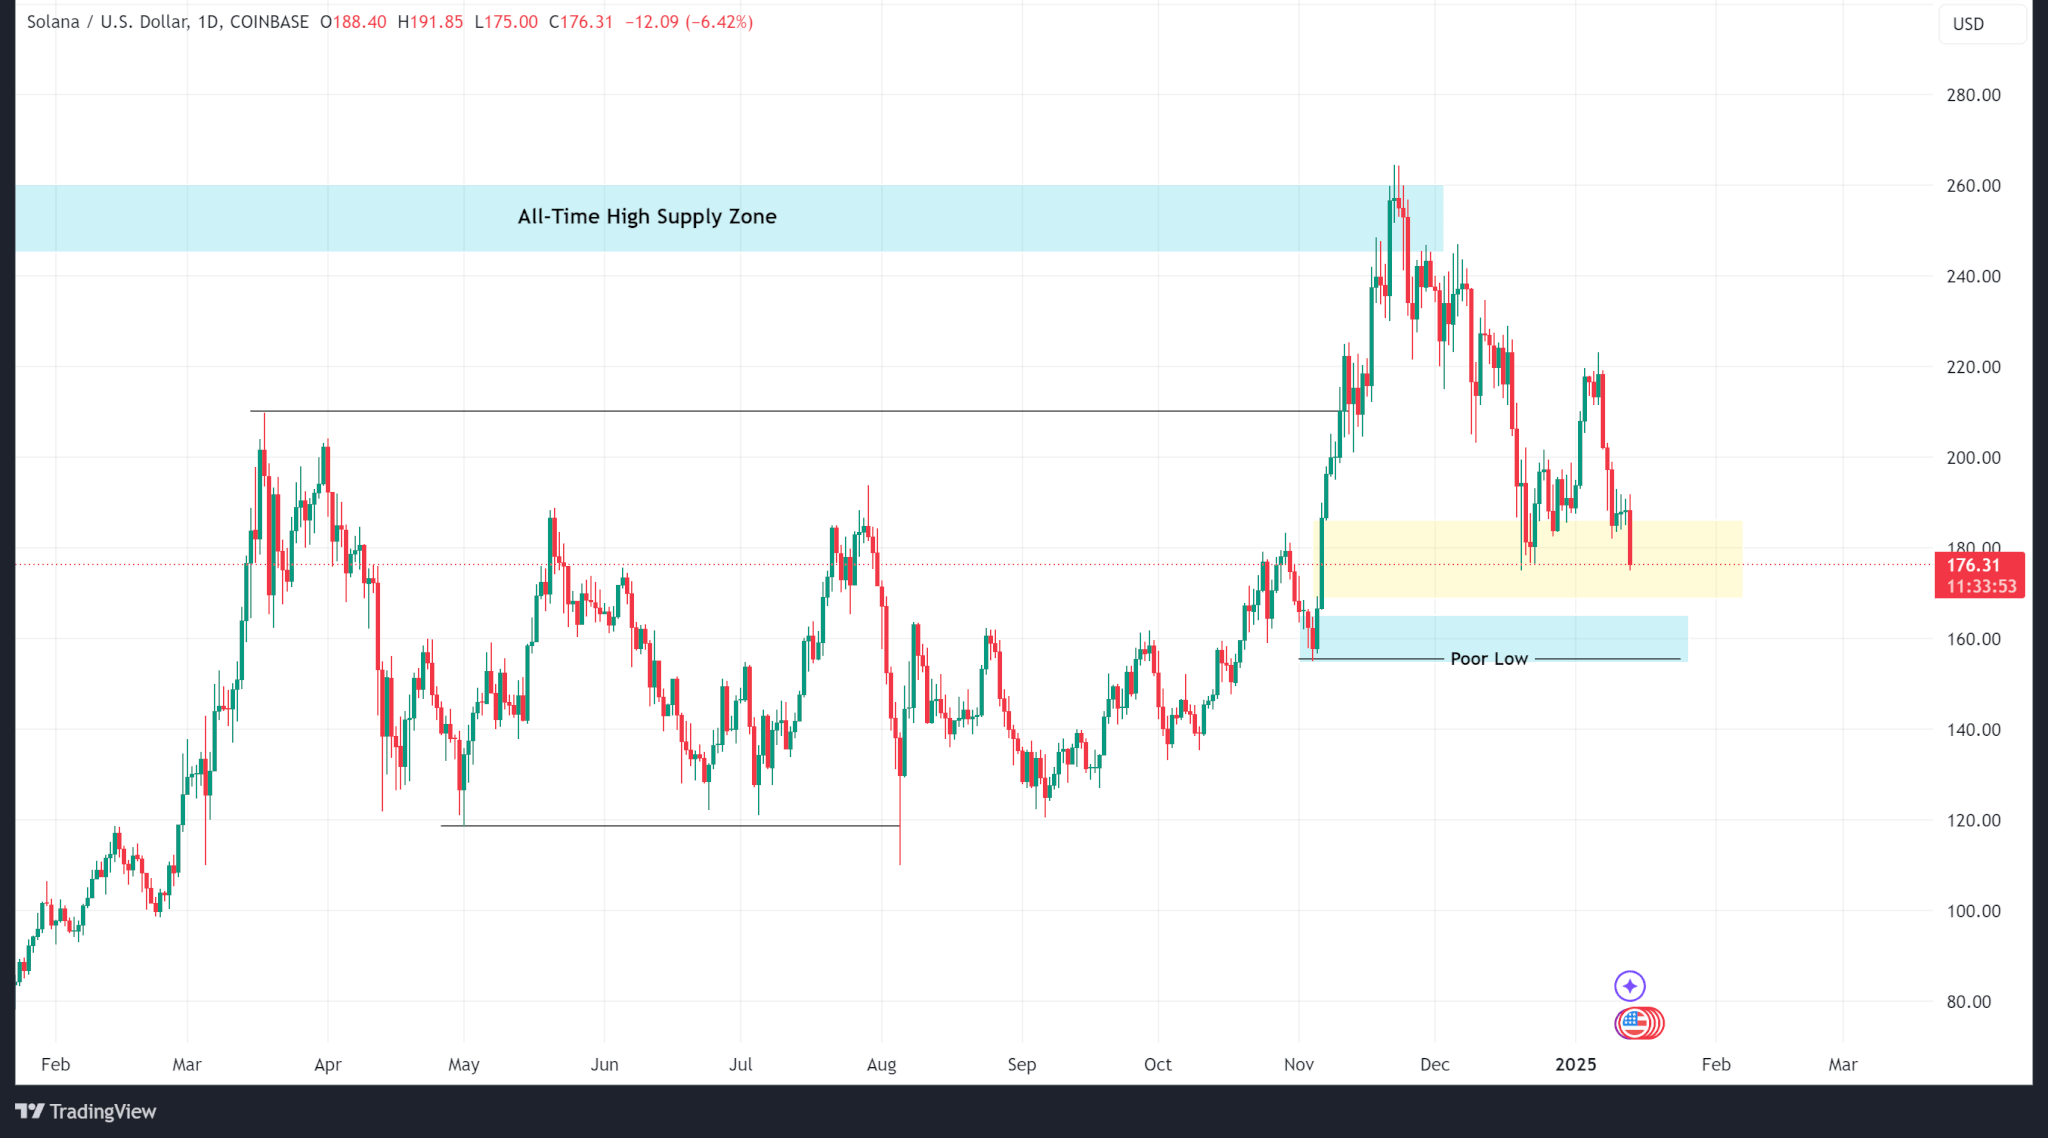
SOL trades at $176 as of publishing.
Ripple
Ripple’s price fared better last week, closing higher at $2.55 from $2.38 at the start of the week as price continued to log higher highs. Zooming out, the price continues to range between $1.90 and $2.90 as the market cools.
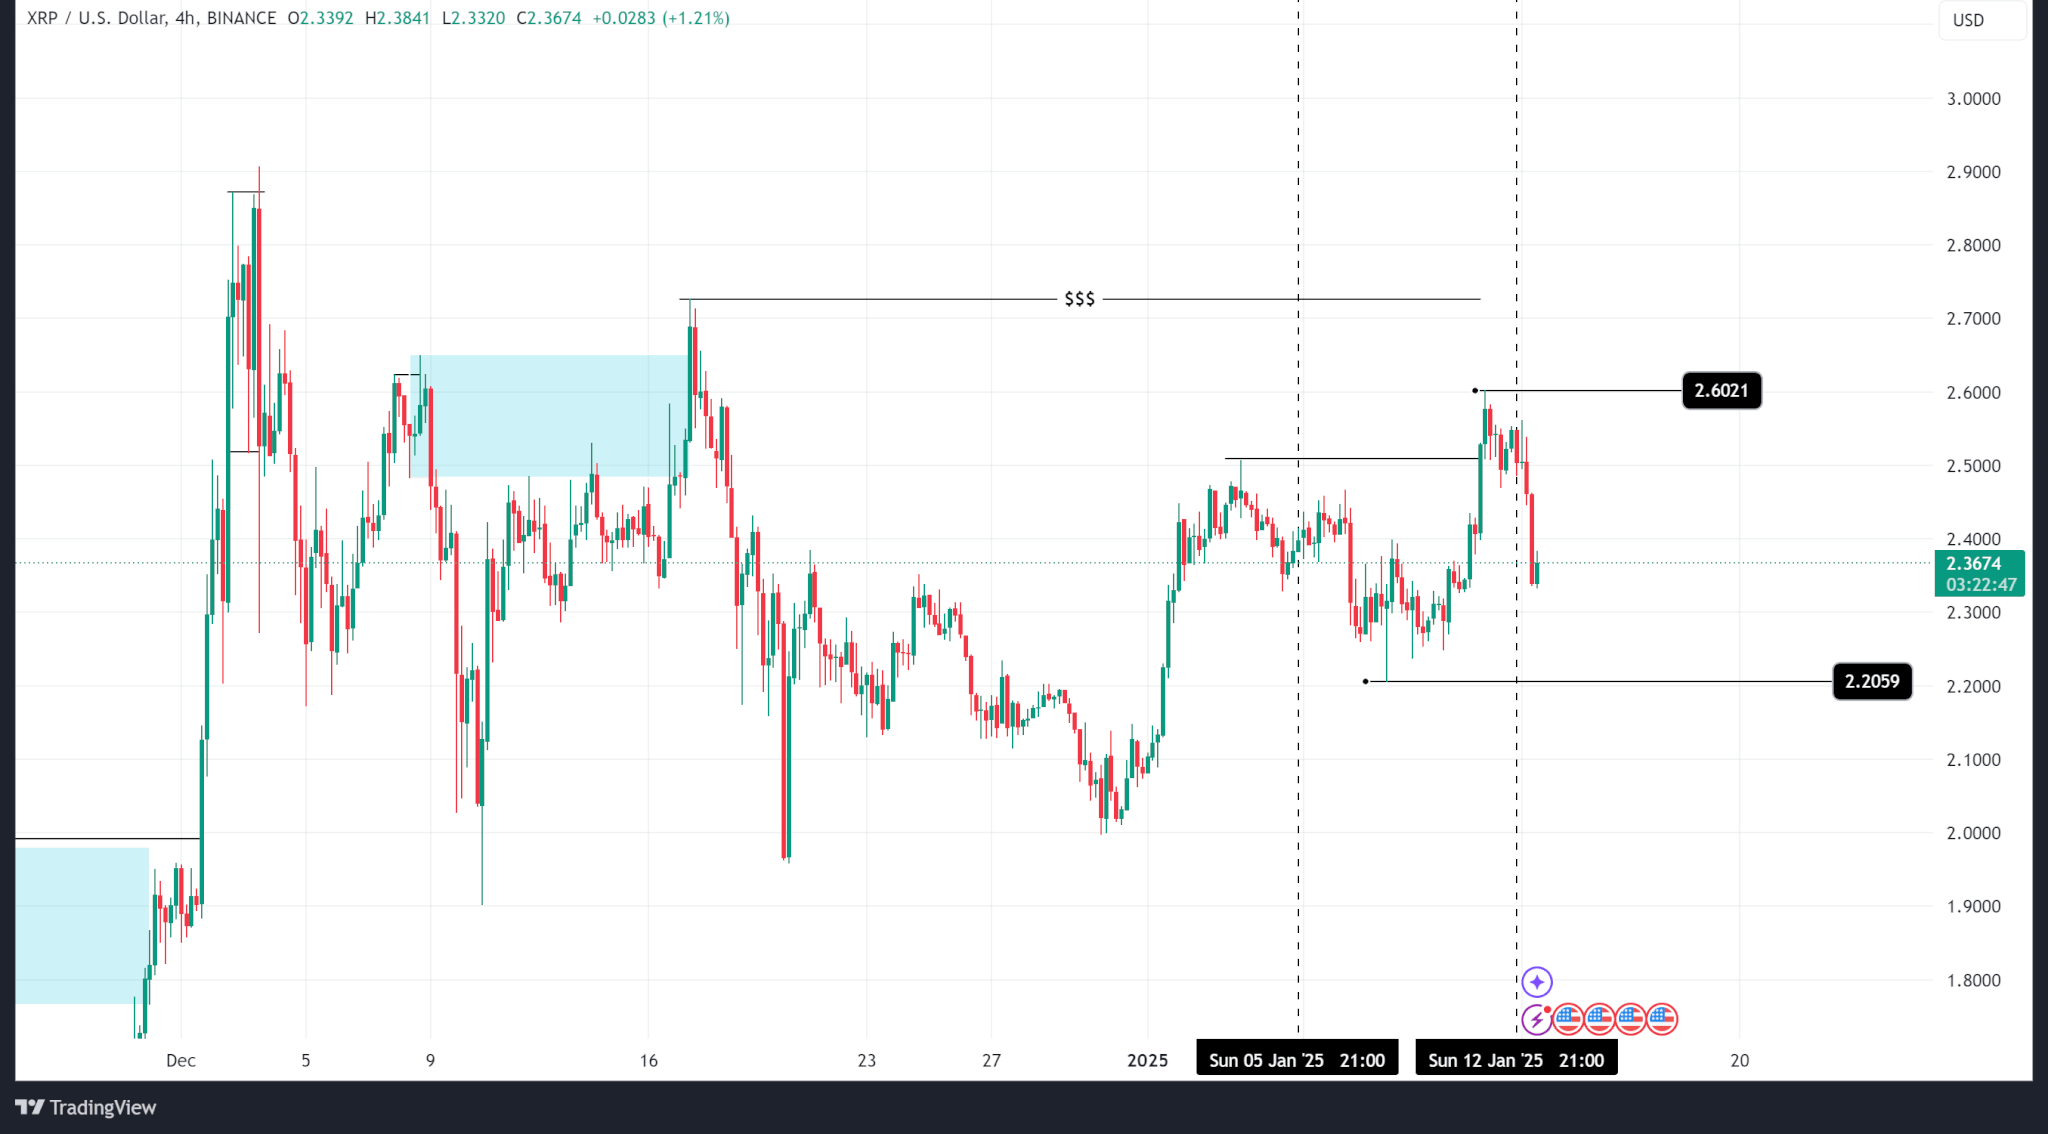
Open interest rose on Bitget, the exchange with the highest XRP derivative trading volume, over the last week, supporting upward price movement as positive news around Ripple’s case with the SEC boosted sentiments.

Outlook
Ripple’s price is buoyed by news around the SEC’s lawsuit against its parent company, a case which could be thrown out with the outgoing administration.
However, technical analysis shows that XRP trades at a premium and a pullback is expected. The most likely levels are the fair value gap at $1.75 and the order block at $1.46.
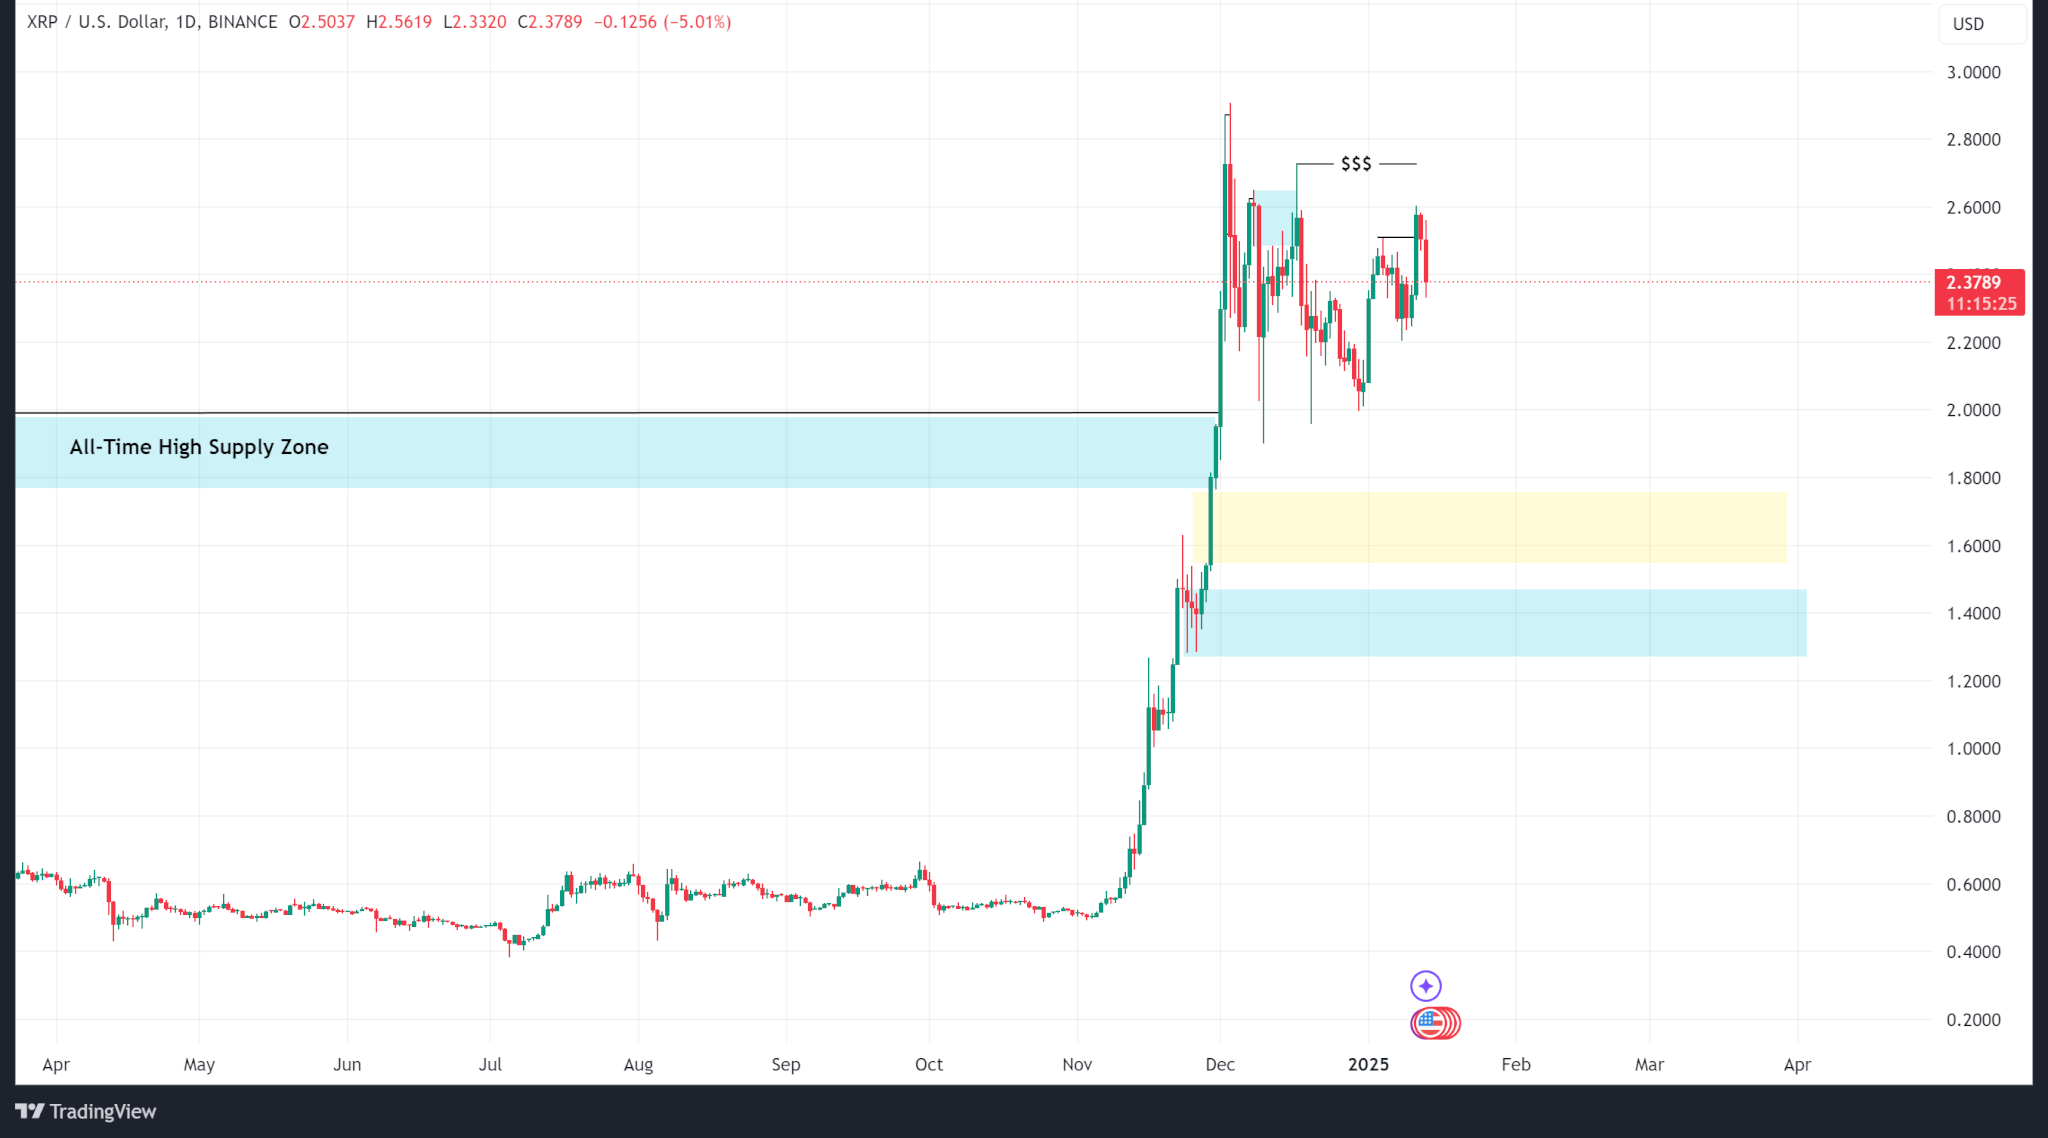
XRP trades at $2.37 as of publishing.


