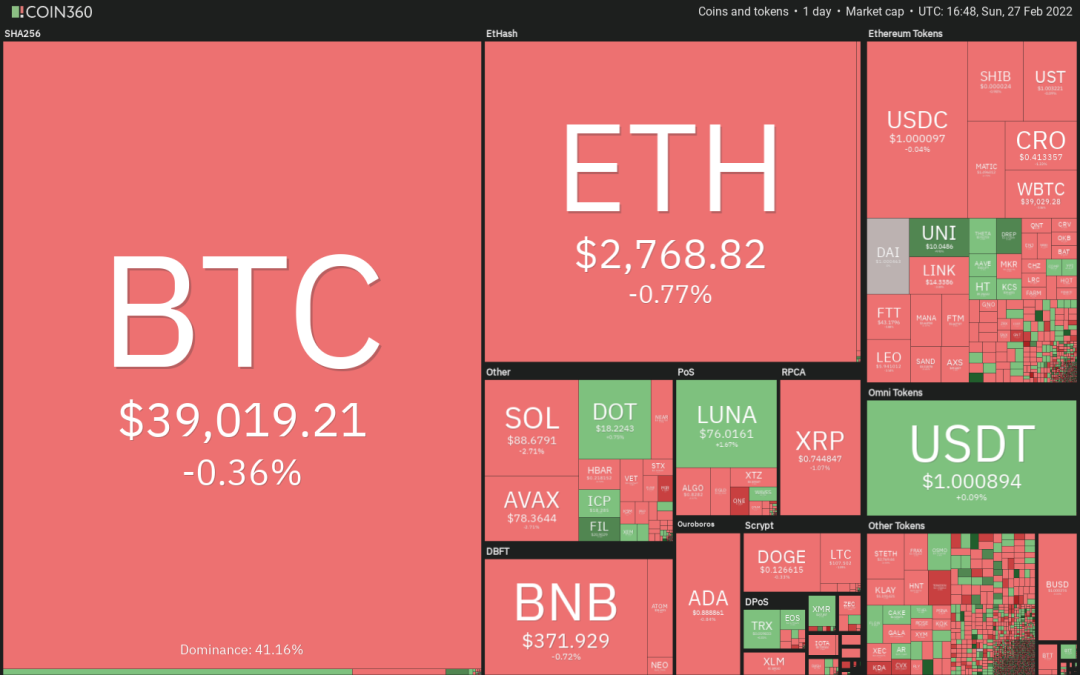
The geopolitical news flow is likely to result in volatile moves in Bitcoin (BTC) and altcoins in the next few days. News of Russian President Vladimir Putin ordering the nuclear deterrence forces on high alert may be viewed as a negative, but reports of talks between the warring nations could be positive as it raises hopes of an end to the conflict.
The crypto community came into focus as the Ukrainian government called for help and sought crypto donations. Some individuals on social media said their Ukrainian credit cards had stopped working and they were not able to withdraw money from their banks. They highlighted how crypto was the only money left with them.
While some analysts are projecting that Bitcoin may have bottomed out, Cointelegraph contributor Marcel Pechman warned that derivatives data remains inconclusive. Similarly, Ether futures data was also not painting a hugely bullish picture.
The near-term price action will be dictated by the developments in the Russia-Ukraine war. Let’s study the charts of the top-5 cryptocurrencies that may lead the recovery on news of a peaceful resolution to the ongoing conflict.
BTC/USDT
Bitcoin’s rebound off the Feb. 24 intraday low at $34,322 reached the moving averages on Feb. 26 where the bears are mounting a strong resistance. However, a minor positive is that the bulls have not given up much ground.

The moving averages are flattening out and the relative strength index (RSI) is attempting to rise to the midpoint, signaling that bulls are making a comeback. If bulls drive and sustain the price above the moving averages, the BTC/USDT pair could rally to the overhead resistance at $45,821. This level is likely to attract strong selling by the bears.
Contrary to this assumption, if the price turns down from the moving averages, the pair could consolidate between $39,600 and $36,250 for a few days. A break and close below this support could open the doors for a possible drop to $32,900.

The 4-hour chart shows that the price has been trading in a tight range between $38,200 and $39,600. The rising 20-exponential moving average and the RSI just above the midpoint indicate a minor advantage to buyers.
A breakout and close above $39,600 could push the price to $41,000 and thereafter to $42,000. The bears are likely to mount a strong resistance in this zone.
If the price turns down from this zone but does not dip back below $39,600, it will suggest that the sentiment has changed from sell on rallies to buy on dips. That could increase the prospects of the continuation of the up-move.
Conversely, a break and close below $38,200 will indicate aggressive selling near $39,600. The pair could then again drop toward $36,250.
LUNA/USDT
Terra’s LUNA token picked up bullish momentum after breaking and closing above the downtrend line. Strong buying pushed the price above the minor resistance at $70 on Feb. 25.

The moving averages are on the verge of a bullish crossover but the RSI is near the overbought zone. This suggests that bulls have the upper hand but the LUNA/USDT pair could witness a minor correction or consolidation in the near term.
On the downside, the bulls are likely to defend the breakout level at $70 and below that the 20-day EMA ($60). If the price rebounds off either support, the pair could extend its rally to $90 where the bears may again offer stiff resistance. This bullish view will be negated on a break and close below the 20-day EMA.

The 4-hour chart shows that the pair had been trading between $47 and $60 for many days. A break and close above $60 signaled the start of a possible new up-move. The 20-EMA is sloping up and the RSI is in the positive zone, indicating advantage to buyers.
If bulls defend the 20-EMA, the possibility of the continuation of the uptrend increases. The pair could then rise above $80 and later rally to the overhead resistance zone between $84 to $87. Conversely, if the price turns down and slips below $70, the pair could drop to $64.
AVAX/USDT
Avalanche (AVAX) has been trading inside the descending channel for the past few days. The price broke below the moving averages on Feb. 20 but the bulls reclaimed the level on Feb. 25, indicating strong buying at lower levels.

The bulls will now attempt to push the price to the downtrend line of the descending channel. This is an important level to watch out for because a break and close above it will indicate a possible change in trend. The AVAX/USDT pair could first rally to $100 and thereafter start an up-move to $120.
Alternatively, if the price turns down from the downtrend line, the pair could drop to the moving averages. If the price rebounds off this level, the possibility of a break above the channel increases.
This bullish view will invalidate if the price turns down from the current level or the overhead resistance and breaks below $70.

The price has been trading between the overhead resistance at $83 and the moving averages. The 20-EMA is flattening out and the RSI is near the midpoint, indicating a balance between supply and demand.
This balance will shift in favor of the bears if they pull the price below $76. The pair could then drop to the next support at $73. Alternatively, if the price rebounds off the current level and breaks above $83, the pair could pick up momentum and rally to the overhead resistance zone at $97 to $100.
Related: Terra’s Mirror Protocol MIR rebounds 40% two days after crashing to record low
ATOM/USDT
Cosmos (ATOM) rebounded from the strong support at $20 on Feb. 24. This indicates that traders are attempting to keep the $20 to $45 range intact.

The price rose above the 20-day EMA ($27) on Feb. 26 and the bulls are attempting to sustain the ATOM/USDT pair above this level. The 20-day EMA is flattening out and the RSI is just above the midpoint, indicating that bulls are attempting a comeback.
If bulls drive and sustain the price above the 50-day simple moving average ($31), the pair could rally to $37. Contrary to this assumption, if the price turns down and slips below the 20-day EMA, it will suggest that bears are defending the overhead resistance at the 50-day SMA. The pair could then drop to $24.

The bulls have pushed the price above the moving averages and the downtrend line on the 4-hour chart. The 20-EMA has started to turn up and the RSI is in the positive territory, indicating that bulls have the upper hand.
If the pair sustains above the downtrend line, the bulls will attempt to clear the barrier at $31 and push the price to $34. Contrary to this assumption, if the price turns down and slips below the 20-EMA, the pair may drop to the 50-SMA.
FTM/USDT
Fantom (FTM) has been trading inside a large range between $1.24 and $3.38 for the past several months. The price rebounded sharply off the support of the range on Feb. 24, indicating that bulls continue to buy at this level.

The rebound has reached the 20-day EMA ($1.82) which is acting as a strong resistance. If bulls drive and sustain the price above this level, the FTM/USDT pair could reach the 50-day SMA ($2.18). A break above this level could clear the path for a possible up-move to $2.60.
Contrary to this assumption, if the price turns down from this level, the pair could consolidate between the 20-day EMA and $1.24 for a few more days. The critical level to watch on the downside is $1.24 because if this level cracks, the pair could start a new downtrend.

The moving averages have completed a bullish crossover on the 4-hour chart indicating that the short-term downtrend could be over. If the price rebounds off the moving averages, it will suggest that traders are buying on dips.
The buyers will then attempt to push and sustain the price above the downtrend line. If they manage to do that, the pair could rise to $2.14 and then to $2.40. This positive view will invalidate in the short term if the pair sustains below the moving averages. Such a move will indicate that bears are active at higher levels.
The views and opinions expressed here are solely those of the author and do not necessarily reflect the views of Cointelegraph. Every investment and trading move involves risk, you should conduct your own research when making a decision.


