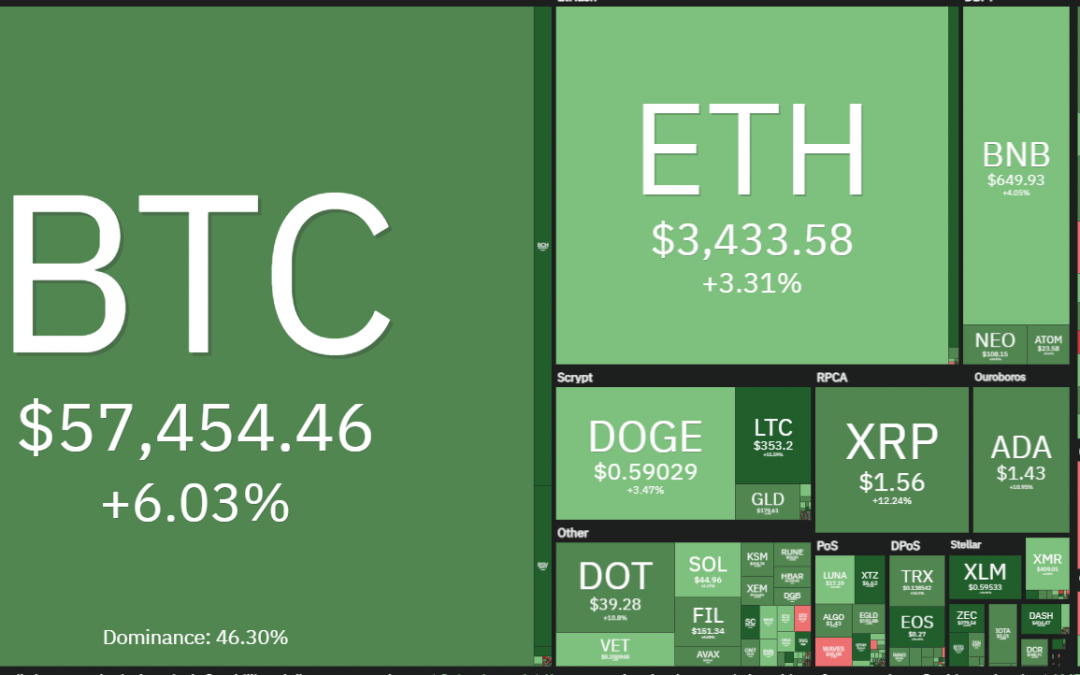
Dogecoin (DOGE) skyrocketed above $0.69 today and flipped XRP to become the fourth largest cryptocurrency with a market capitalization of over $88 billion at its highest point.
Galaxy Digital recently released a report titled “Dogecoin: The Most Honest Sh*tcoin,” and the document highlighted the fact that no updates have been logged in Dogecoin’s GitHub repository since 2017. Even the blockchain’s network security is suboptimal with only 26% of the overall node count running fully synced notes, the report added.
There seems to be a massive mismatch between Dogecoin’s fundamentals and its valuation. The meme coin’s rally is an indication that traders are driven by greed and such phases of frenzy never end well. When the bubble bursts, several investors will be left nursing massive losses.
Moving away from the Dogecoin frenzy, the latest CoinShares report shows weekly institutional inflows of $489 million for various crypto products. Bitcoin (BTC) accounted for the lion’s share of the investments at $411.7 million.
This shows that institutional investors are viewing the current weakness in Bitcoin as a buying opportunity. The total crypto assets under management is at $64.7 billion, having risen about $7 billion in the past six weeks.
Will Ether (ETH) continue to pull altcoins higher or will Bitcoin make a comeback? Let’s analyze the charts of the top-10 cryptocurrencies to find out.
BTC/USDT
Bitcoin plunged below the moving averages on May 4 but the bears could not capitalize on this weakness. This suggests the bulls have not yet given up and they continue to buy on every dip.

The bulls have pushed the price above the moving averages today and they will now try to challenge the downtrend line and the overhead resistance at $58,966.53. A breakout of this resistance zone will clear the path for a possible retest of the all-time high at $64,849.27.
However, the flattish moving averages and the relative strength index (RSI) near the midpoint suggest a balance between supply and demand. This could keep the BTC/USDT pair stuck between $52,323.21 and $58,966.51 for a few days.
The bears may gain the upper hand if the price turns down and plummets below $52,323.21. Such a move will suggest weakness and that could result in a decline to the critical support at $46,985.
ETH/USDT
Ether is in a momentum-driven uptrend. Generally, in such phases of melt-up, the asset may remain overbought for an extended duration and corrections can be sharp but are usually short-lived. After a one-day pullback on May 4, the bulls are trying to resume the up-move today.

If buyers propel the price above $3,527.19, the ETH/USDT pair could rally to $4,528.97. However, the farther the price moves away from the moving averages, the greater the risk of a massive correction. Therefore, traders should exercise caution.
If the price reverses direction from $3,500, it will indicate profit-booking at higher levels. The bears will then try to pull the price below $3,165.30, which could result in a decline to the 20-day exponential moving average ($2,731).
A strong rebound off this level will suggest the uptrend remains intact. The bulls then try to resume the up-move. Conversely, a break below the 20-day EMA will suggest the pair has formed a short-term top.
BNB/USDT
Binance Coin’s (BNB) sharp correction on May 4 attracted buyers near the $600 mark. This suggests the sentiment remains bullish and traders are accumulating at lower levels.

The rising moving averages and the RSI in the positive territory suggest the path of least resistance is to the upside. If the buyers push the price above $680, the uptrend could resume with the next target objective at $808.57.
This positive view will nullify if the price turns down from the overhead resistance and breaks below the 20-day EMA ($567). Such a move will suggest that supply exceeds demand and the BNB/USDT pair could then drop to the 50-day simple moving average ($436).
DOGE/USDT
Dogecoin is in a strong melt-up. The bulls pushed the price above the $0.45 resistance on May 4, which resulted in a pick-up in momentum. The long wick on May 4 suggested profit-booking by traders near $0.61 but the bears could not maintain the selling pressure.
According to data from Cointelegraph Markets Pro, market conditions for DOGE have been favorable for some time.
The VORTECS Score, exclusive to Cointelegraph, is an algorithmic comparison of historic and current market conditions derived from a combination of data points including market sentiment, trading volume, recent price movements and Twitter activity.

 Score (green) vs. DOGE price. Source: Cointelegraph Markets Pro
As seen in the chart above, the VORTECS Score for DOGE flipped green on May 2 when the price was $0.38, well before the indication of any rally.
Since then, the VORTECS Score has largely remained in the green and DOGE rallied to $0.69 today, an 86% gain in about four days.

The buying resumed today and the DOGE/USDT pair hit a new all-time high at $0.69. However, the long wick on the day’s candlestick suggests profit-booking at higher levels. The pair could now drop to the breakout level at $0.45. A break below this level could pull the price to the 20-EMA ($0.33).
Alternatively, if the bulls flip this level into support, the pair may again try to rise above $0.69. If that happens, the rally may extend to $0.84 and then $1.
Frenzied buying in an asset can result in strong rallies. However, traders should be careful and protect their capital with a trailing stop-loss because vertical rallies can quickly reverse direction, resulting in sharp losses.
XRP/USDT
XRP dropped below the 20-day EMA ($1.39) on May 4 but the bears could not sustain the lower levels. This shows the bulls are defending the 20-day EMA. The price has reached the downtrend line where the bears are likely to mount a stiff resistance.

If the price turns down from the downtrend line, the bears will make one more attempt to sink the BNB/USDT pair below the 20-day EMA. If they manage to do that, the pair could slide to the 50-day SMA ($1.05).
On the contrary, if the bulls thrust the price above the downtrend line, the up-move may resume and the bulls may try to push the price to $1.96. A breakout of this resistance will suggest the start of the next leg of the uptrend.
ADA/USDT
Cardano (ADA) broke below the 20-day EMA ($1.29) on May 4 but the bulls defended the 50-day SMA ($1.24). The buyers are currently trying to push the price toward the resistance of the range at $1.48.

The ADA/USDT pair is likely to face stiff resistance near the $1.48 to $1.55 zone. If the price turns down from this zone, the pair could again drop to the moving averages and extend the stay inside the range for a few more days.
Contrary to this assumption, if the price turns down and breaks below the 50-day SMA, the pair may gradually drop to $1.03. A strong bounce off this support will suggest that traders continue to buy on dips to the support of the range.
Until the bulls push the price above $1.55 or the bears sink the pair below $0.98, the range-bound action is likely to continue.
DOT/USDT
Polkadot (DOT) plummeted below the 20-day EMA ($36) on May 4 but the bulls did not panic and dump their positions. Rather, they bought the dip and have pushed the price back above the moving averages today.

If the bulls sustain the price above $38.30, the DOT/USDT pair may rally to $42.28 and then to $48.36. However, the flat moving averages and the RSI just above the midpoint suggest a balance between supply and demand.
This indicates the pair is likely to hit a wall at $42.28. If the price turns down from this resistance, the range-bound action is likely to continue. The next trending move could start if the price breaks above $50 or plunges below $26.50.
LTC/USDT
Litecoin (LTC) broke above the $335.03 overhead resistance today, indicating the resumption of the uptrend. The 20-day EMA ($271) has turned up and the RSI is in the overbought zone, suggesting the bulls are in command.

If the buyers push the price above the resistance line of the ascending broadening wedge pattern, the LTC/USDT pair could pick up momentum and rally to $400 and then $463.31.
However, the bears are likely to have other plans. They will try to stall the up-move at the resistance line. If the price turns down from this resistance, the pair could drop to $308 and then to the 20-day EMA.
A strong rebound off the 20-day EMA will suggest the sentiment remains positive. The bulls will then make one more attempt to resume the uptrend. This bullish view will invalidate if the price turns down and plummets below the support line of the wedge.
BCH/USDT
After days of hesitation near the 61.8% Fibonacci retracement level at $1,012.29, Bitcoin Cash (BCH) soared above the $1,213.51 resistance today, indicating the resumption of the uptrend.

If the bulls manage to sustain the price above $1,213.51, the BCH/USDT pair could rally to $1,410.42 and then $1,710.39.
Contrary to this assumption, if the bulls fail to sustain the price above $1,213.51, the pair could drop to $1,050. If the pair rebounds off this level, the bulls will make one more attempt to start the next leg of the uptrend.
However, a break below $1,050 will suggest that supply exceeds demand and that could pull the price down to the 20-day EMA ($926).
UNI/USDT
Uniswap (UNI) rebounded off the $39.60 support on May 5, which shows the bulls are defending this level aggressively. If the buyers propel the price above $45, the next leg of the uptrend could begin. The target objective on the upside is a rally to the resistance line of the ascending channel at $50.

The rising 20-day EMA ($38.35) suggests the buyers have the advantage but the negative divergence on the RSI indicates the bullish momentum may be weakening.
A break below the 20-day EMA will be the first sign that the bears are making a comeback. The UNI/USDT pair could then drop to the support line of the channel where buyers may emerge.
A strong bounce off this support will suggest buying at lower levels and the uptrend may remain intact. Conversely, a break below the channel will signal a possible change in trend.
The views and opinions expressed here are solely those of the author and do not necessarily reflect the views of Cointelegraph. Every investment and trading move involves risk. You should conduct your own research when making a decision.
Market data is provided by HitBTC exchange.


