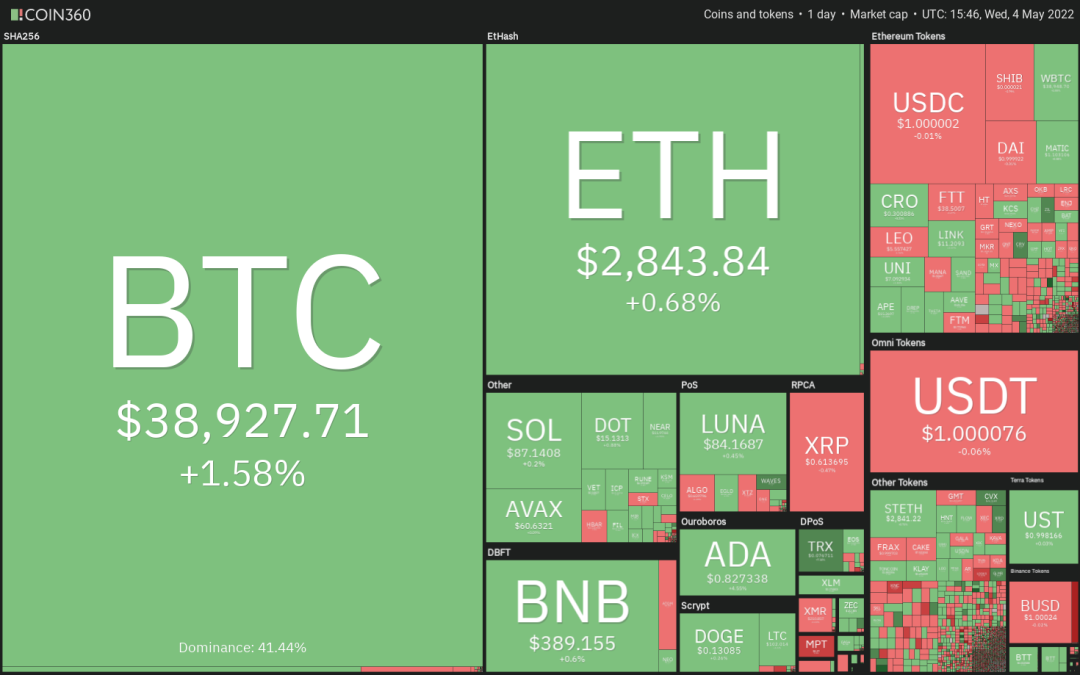
Investors across the world are waiting for the outcome of the Federal Open Market Committee meeting on May 4. Although markets expect a 50 basis point rate hike and an announcement by the Fed to start shrinking its balance sheet from June, it is difficult to predict how the markets will react to this trigger.
Billionaire investor Paul Tudor Jones, in an interview with CNBC, said that the United States was entering “uncharted territory” as rates were being raised when the Financial Conditions Index was tightening. Tudor Jones warned investors that it was “going to be a very, very negative situation” for both stocks and bonds. He added that the current environment for financial assets was the worst.
Due to the uncertainty, some investors seem to be reducing their crypto exposure. That led to weekly outflows of $132.7 million from Bitcoin (BTC) funds last week, the largest since June of last year, according to a report from CoinShares.
Could Bitcoin and altcoins enter a period of capitulation or will investors buy after the Fed event is over? Let’s study the charts of the top-10 cryptocurrencies to identify the critical levels to watch out for both on the upside and the downside.
BTC/USDT
The bulls have successfully defended the support line of the ascending channel for the past four days, which is a positive sign. If buyers propel the price above the 20-day exponential moving average (EMA) ($39,553), it will suggest that the bears may be losing their grip.

The BTC/USDT pair could then rally to the 50-day simple moving average (SMA) ($41,922). This level may again act as resistance but if bulls overcome this barrier, the pair could rally toward the 200-day SMA ($46,924).
Contrary to this assumption, if the price turns down from the 20-day EMA or the 50-day SMA, it will suggest that bears continue to sell on rallies. The pair could then again retest the support line of the channel.
A break and close below the channel could open the doors for a further decline to $34,300 and later to $32,917.
ETH/USDT
Ether (ETH) tried to rise above the 20-day EMA ($2,920) on May 2 but failed. A minor positive is that the bulls did not give up much ground and are again attempting to clear the overhead hurdle.

If buyers thrust the price above the 20-day EMA, the ETH/USDT pair could rally to the 50-day SMA ($3,069). The bulls will have to push and sustain the price above this level to signal a change in the short-term trend. The pair could then rise to the 200-day SMA ($3,441). A break and close above this level could indicate the start of a new uptrend.
On the other hand, if the price turns down from the 20-day EMA, it will suggest that bears are not willing to let go of their advantage. That could enhance the prospects of a break below the uptrend line. If that happens, the pair could plummet to $2,450.
BNB/USDT
BNB has been trading below the $391 support for the past four days but the bears could not build upon this advantage and sink the price to $350. This indicates a lack of sellers at lower levels.

The bulls are attempting to push the price above the $391 resistance. If they do that, the BNB/USDT pair could rise to the 50-day SMA ($412). A break and close above this resistance could signal advantage to buyers. The pair could then rally to the 200-day SMA ($468).
This positive view could invalidate in the short term if the price turns down from the overhead resistance and plummets below $375. That will indicate renewed selling and may pull the pair down to $350.
SOL/USDT
Solana (SOL) is finding buying support near $82 but the bulls have not succeeded in pushing the price above the 20-day EMA ($96). This suggests that demand dries up at higher levels.

If the price fails to rise above the 20-day EMA, the bears will try to sink the SOL/USDT pair below the strong support at $75. This is an important level to keep an eye on because if the support cracks, the pair could resume the downtrend. The next support on the downside is $66.
Contrary to this assumption, if bulls push the price above the 20-day EMA, it will suggest that the selling pressure may be reducing. The pair could then rise to $111 and later extend its stay inside the large range between $75 and $143.
XRP/USDT
Ripple (XRP) has been stuck inside a large range between $0.55 and $0.91 for the past several days. The price rebounded off $0.56 on April 30 and the bulls are attempting to overcome the hurdle at $0.62.

If the price sustains above $0.62, the recovery could reach the 20-day EMA ($0.67). This level may again act as a stiff resistance. If the price turns down from the 20-day EMA, the bears will try to sink the XRP/USDT pair to the critical support at $0.55. A break and close below this support could pull the pair to the psychological level at $0.50.
Contrary to this assumption, if bulls drive the price above the 20-day EMA, the pair could rally to the 50-day SMA ($0.75). Such a move will suggest that the pair may spend some more time inside the large range.
LUNA/USDT
Terra’s LUNA token rallied to the 20-day EMA ($87) Wednesday but the long wick on the day’s candlestick suggests that bears continue to sell on rallies.

The sellers will now try to pull the price to the strong support zone between $75 and the 200-day SMA ($71). If this zone gives way, the LUNA/USDT pair will complete a bearish head and shoulders pattern, signaling a potential trend change. The pair could then start its downward journey toward $50.
Alternatively, if bulls push and sustain the price above the downtrend line, it will suggest that the short-term corrective phase may be over. The pair could rise to the psychological resistance at $100. A break and close above this level could clear the path for a possible retest of the all-time high at $119.
ADA/USDT
Although Cardano (ADA) was trading close to the critical level at $0.74 for the past few days, the bears could not break the support. This suggests that bulls defended the support aggressively.

The ADA/USDT pair could now recover to the 20-day EMA ($0.86) where the bears may again mount a strong resistance. If the price turns down from the 20-day EMA, the sellers will again try to pull the pair below $0.74. If they manage to do that, the pair could start the next leg of the downward move to $0.68.
Conversely, if bulls propel the price above the 20-day EMA, the pair could attempt a rally to the overhead resistance at $1. A break and close above this level could suggest that bulls are back in the game.
Related: Ethereum eyes mini breakout above $3K as Coinbase ETH outflows hit new record
DOGE/USDT
Dogecoin (DOGE) has been trading below the moving averages for the past few days but the bears have not been able to challenge the support at $0.12. This suggests a lack of sellers at lower levels.

The bulls will now try to push the price above the 20-day EMA ($0.13). If they manage to do that, the DOGE/USDT pair could rise to $0.15 and thereafter attempt a rally to the stiff overhead resistance at $0.17. This is an important level for the bears to defend because a break and close above it could signal the start of a new uptrend.
Conversely, if the price turns down from the 20-day EMA, the bears will fancy their chances and try to sink the pair below $0.12. If that happens, the pair could slide to the psychological support at $0.10.
AVAX/USDT
Avalanche (AVAX) is trading inside a large range between $51 and $99. The bulls purchased the dip to $55 on April 30 but they have not been able to push the price above the breakdown level at $65.

If the price turns down from $65, it will suggest that the sentiment remains negative and bears are selling on rallies. The bears will then make one more attempt to pull the AVAX/USDT pair below the strong support at $51. If they succeed, the pair could start the next leg of the downtrend which could result in a decline to $32.
This negative view could invalidate in the short term if bulls drive and sustain the price above the 20-day EMA ($68). The pair could then rise to the 50-day SMA ($80).
DOT/USDT
Polkadot (DOT) is range-bound in a downtrend. The bulls are defending the support at $14 while the bears are selling on rallies to $16. This tight-range trading is unlikely to continue for long.

If buyers push the price above $16, the DOT/USDT pair will attempt to rise above the 20-day EMA ($16.86). If that happens, it will suggest that the bears may be losing their grip. The pair could then rise to the overhead resistance at $19 where the bears may again try to stall the recovery.
Alternatively, if the price turns down from the overhead resistance, the pair may spend some more time inside the range. The bears will have to sink and sustain the price below the support at $14 to indicate the resumption of the downtrend.
The views and opinions expressed here are solely those of the author and do not necessarily reflect the views of Cointelegraph. Every investment and trading move involves risk. You should conduct your own research when making a decision.
Market data is provided by HitBTC exchange.


