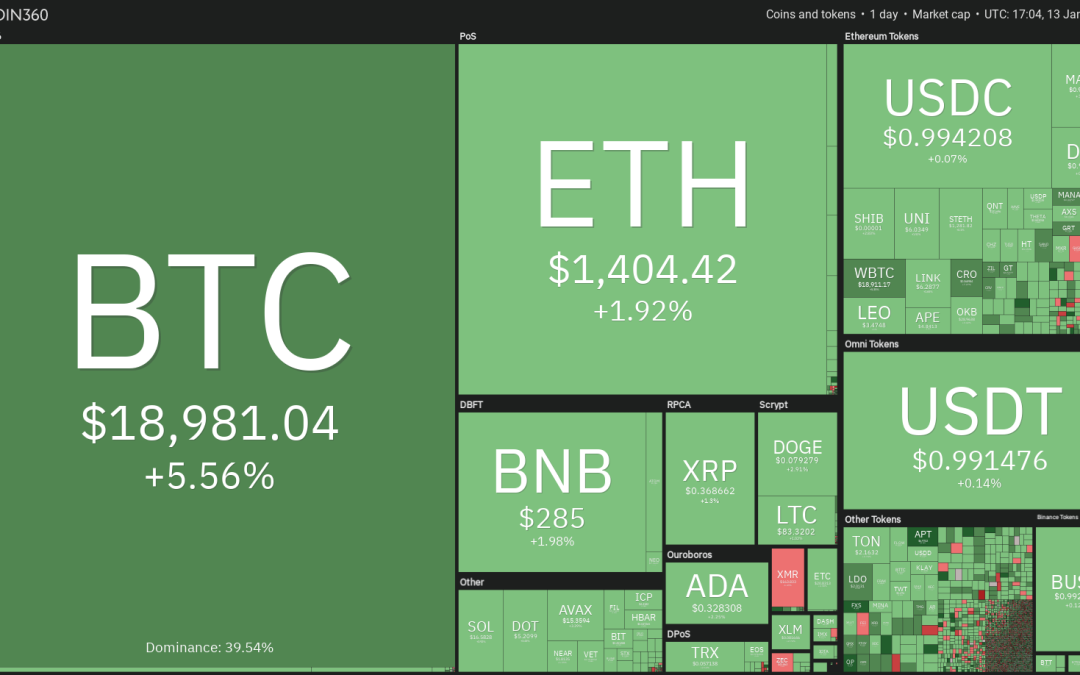
Bitcoin (BTC) rose above $19,000 on Jan. 12, the highest level since Nov. 8. Although a bull market may not start in a hurry, Glassnode data suggests that the foundation for a macro bottom in Bitcoin may be in place. The on-chain analytics firm tweeted on Jan. 12 that “13% of the Circulating Supply” returned to profit when Bitcoin rallied to $18,200. This suggests a large phase of accumulation took place in the $16,500 to $18,200 range.
Along with Bitcoin, Ether (ETH) is also witnessing signs of accumulation. The number of Ethereum sharks, holding between 100 and 10,000 Ether, has risen by 3,000 since November 22, according to Santiment data.
Many times, traders miss a bottom because they remain in denial. If traders want to catch a trend early, they should keep a close eye on the price action because a sequence of higher highs and higher lows may indicate a bullish sentiment.
Are Bitcoin and altcoins showing signs of starting a new uptrend? Let’s study the charts of the top-10 cryptocurrencies to find out.
BTC/USDT
Bitcoin is on the path of recovery. Strong buying by the bulls propelled the price above the stiff overhead resistance at $18,388 on Jan. 12. This is the first indication that the bears may be losing their grip.

The sharp rally of the past few days has pushed the relative strength index (RSI) into overbought territory, signaling a possible correction or consolidation in the near term.
If bulls do not allow the price to dip below the breakout level of $18,388, it will suggest a change in sentiment from selling on rallies to buying on dips. The BTC/USDT pair could then continue its recovery toward the next major resistance at $21,500.
If bears want to slow down the positive momentum, they will have to quickly pull the price back below $18,388. The pair could then drop to the 20-day exponential moving average ($17,378).
ETH/USDT
Ether soared above the overhead resistance of $1,352 on Jan. 11 and followed that up with a break above the downtrend line on Jan. 12. This suggests that the bulls are on a strong comeback.

The bears will try to stall the recovery and pull the price back below the breakout level of $1,352. If that happens, the ETH/USDT pair could slide to the 20-day EMA ($1,292). A strong bounce off this level will suggest that traders are buying the dips. That could improve the prospects of a rally toward $1,700. This level may again act as a strong hurdle.
The positive view could invalidate if the price turns down and plummets below the moving averages. Such a move could indicate that the recent breakout may have been a bull trap.
BNB/USDT
BNB (BNB) bounced off the 50-day SMA ($268) on Jan. 10 and continued its northward march. The price is nearing $300 where the bears may mount a strong resistance.

The upsloping 20-day EMA ($266) and the RSI near the overbought territory indicate advantage to buyers. If the price turns down from $300, it is likely to find support at the 20-day EMA ($266). A strong bounce off this level could catapult the BNB/USDT pair to the $318 to $338 resistance zone.
Contrary to this assumption, if the price turns down and slides below the moving averages, the pair could retest the $250 to $236 support zone.
XRP/USDT
XRP (XRP) dipped below the 50-day SMA ($0.37) on June 12 but the bulls successfully defended the breakout level from the symmetrical triangle.

The gradually upsloping 20-day EMA ($0.35) and the RSI in the positive zone indicate that bulls have the upper hand. Buyers will try to drive the price above $0.38 and extend the up-move to $0.42.
Conversely, if the price fails to sustain above the 50-day SMA ($0.37), the bears will again try to pull the XRP/USDT pair back into the triangle. If they do that, the pair could tumble to the support line of the triangle.
ADA/USDT
The bears tried to sink Cardano (ADA) back into the wedge on Jan. 11 but the long tail on the candlestick shows strong buying at lower levels.

The ADA/USDT pair has continued its up-move, which has pushed the RSI into the overbought territory. This suggests that the rally may be overheated in the near term and the pair could enter a short-term correction or consolidation.
If the price turns down from the current level but rebounds off the 20-day EMA ($0.29), it will suggest demand at lower levels. Buyers will then again try to clear the hurdle at $0.35 and launch a rally to $0.38 and later to $0.44. The bears will have to yank the price below the moving averages to gain the upper hand.
DOGE/USDT
The bears tried to pull Dogecoin (DOGE) below the 20-day EMA ($0.07) on Jan. 11 and 12 but the bulls held their ground. Buyers are trying to kick the price above the 50-day SMA ($0.08) on Jan. 13.

If they manage to do that, the DOGE/USDT pair could pick up pace and start a rally toward $0.11. This level may witness strong selling by the bears. If the price turns down sharply from it, there is a possibility that the pair may stay range-bound between $0.07 and $0.11 for some time.
Another possibility is that the price turns down from the 50-day SMA and tumbles below the 20-day EMA. That will suggest a negative sentiment and may keep the pair stuck between the 50-day SMA and $0.07 for a while longer.
MATIC/USDT
The long tail on Polygon’s (MATIC) Jan. 12 candlestick shows that traders are buying the dips to the moving averages. Buyers will try to push the price to $0.97, which may act as a roadblock.

The 20-day EMA ($0.84) has started to turn up and the RSI is near 67, signaling that the path of least resistance is to the upside. If the bulls do not give up much ground from $0.97, the MATIC/USDT pair could continue its up-move and touch $1.05.
As the pair has been stuck inside the large range between $0.69 and $1.05 for the past several days, the bears may sell aggressively near the resistance. On the downside, a drop below the moving averages could tilt the short-term advantage in favor of the sellers.
Related: Bitcoin price wants to retest 2017 all-time high near $20K — analysis
LTC/USDT
After facing resistance at $85 for a few days, Litecoin (LTC) soared above the level on Jan. 12. However, the bulls are struggling to sustain the higher levels.

If the price falls and closes below $85, it will suggest that the bears have not yet given up. The sellers will then try to sink the price to the 20-day EMA ($77).
This is an important level to keep an eye on because a strong rebound off it will suggest that the sentiment is positive and traders are buying on pullbacks. The bulls will then again attempt to thrust the LTC/USDT pair above the overhead resistance and resume the uptrend toward $100.
The bears will gain the upper hand if they drag the price below the 50-day SMA ($74). That could open the doors for a decline to $61.
DOT/USDT
The bears tried to halt Polkadot’s (DOT) recovery at the 50-day SMA ($4.92) on Jan. 9 and 10 but the bulls did not surrender. They bulldozed their way above the resistance on Jan. 11.

The DOT/USDT pair will try to touch the downtrend line. The sellers have halted recovery attempts near the downtrend line on three previous occasions, hence they will try to repeat their performance.
If the price turns down from this resistance but turns up from the moving averages, it will suggest a change in sentiment from selling on rallies to buying on dips. The bulls will then again attempt to propel the pair above the downtrend line.
This positive view will be negated if the price turns lower and plummets below the moving averages.
UNI/USDT
Uniswap (UNI) reached close to the resistance line of the symmetrical triangle on Jan. 12 but the bulls could not clear this hurdle. That may have tempted short-term traders to book profits.

The 20-day EMA ($5.62) has started to turn up and the RSI is in the positive zone, indicating that buyers have a slight edge. If the price springs back from the 20-day EMA, the bulls will again attempt to drive the UNI/USDT pair above the triangle. If they succeed, it will suggest the start of a new up-move that could reach $7.80.
On the contrary, if the price slumps below the moving averages, it will suggest that the pair may remain stuck inside the triangle for a few more days.
The views, thoughts and opinions expressed here are the authors’ alone and do not necessarily reflect or represent the views and opinions of Cointelegraph.
This article does not contain investment advice or recommendations. Every investment and trading move involves risk, and readers should conduct their own research when making a decision.


