Litecoin’s price has traded as high as $112 in the past 24 hours, breaking into the three-digit price level for the first time since the summer of 2019
Litecoin has jumped above $100 for the first time in over a year following this week’s impressive 50% rally. After Bitcoin’s price jumped to a new all-time high (ATH) near $23,800, Litecoin followed suit and is trading higher with an intraday upside of more than 18%.
At the time of writing, the LTC price is changing hands around $107, with a 24-hour trading volume of more than $11 billion. The rally sees Litecoin move into the fifth spot among the largest cryptocurrencies by market cap.
According to data from CoinMarketCap, Litecoin’s market cap is $7.18 billion—ahead of Bitcoin Cash ($5.8 billion) and ChainLink ($5.4 billion).
Litecoin price analysis
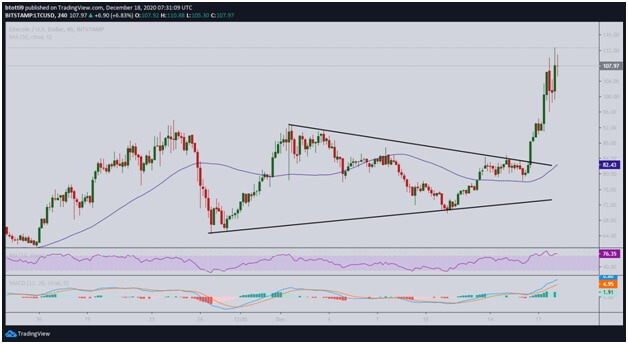
LTC has posted a sharp increase in its price against the US dollar, the recent gains coming on the back of a breakout off a key bearish trendline. The daily chart shows LTC/USD breaking higher after breaching the upper boundary of a contracting triangle pattern. The upper trendline had recently capped prices under $93.
But the breakout has since helped establish a critical support zone around the $100 price level. From a technical perspective, the LTC/USD pair will break higher if sentiment continues north and bulls crack the immediate resistance line around $108.
LTC/USD daily chart. Source: TradingView
A retest of the intraday high at $112 could result in more buy-side pressure and allow optimism to push LTC/USD to $120. A rise in the daily RSI (and above 70) suggests bulls retain the advantage and short term action is likely to be towards the upside.
On the downside, the initial support is near the 23.6% Fibonacci retracement level of the upswing from $69.90 low to $112.69 high. The area provides a cushion around $102, below which bears might break to the psychological support at $100.
The 38.2% Fib retracement level ($96.31) and 50% Fib retracement level ($86.31) offer further support. If Litecoin tanks near term, the 50-day simple moving average ($74.35) and the 100-day simple moving average ($61.64) offer reliable support levels.
 LTC/USD 4-hour chart. Source: TradingView
Looking at the 4-hour chart, the LTC price is struggling with resistance around $107. While price remains well above the contracting triangle, bulls need to breach the barrier to retest the $112 high.
Both the 4-hour MACD and 4-hour RSI for LTC/USD support a bullish outlook short term but could flip negative to hand bears something to grip onto. If it drops below $102 and $100, the main support zone is at the 50-SMA ($82.43) on the 4-hour chart.
The post Litecoin (LTC) enters top 5 as price crosses $100 barrier appeared first on Coin Journal.


