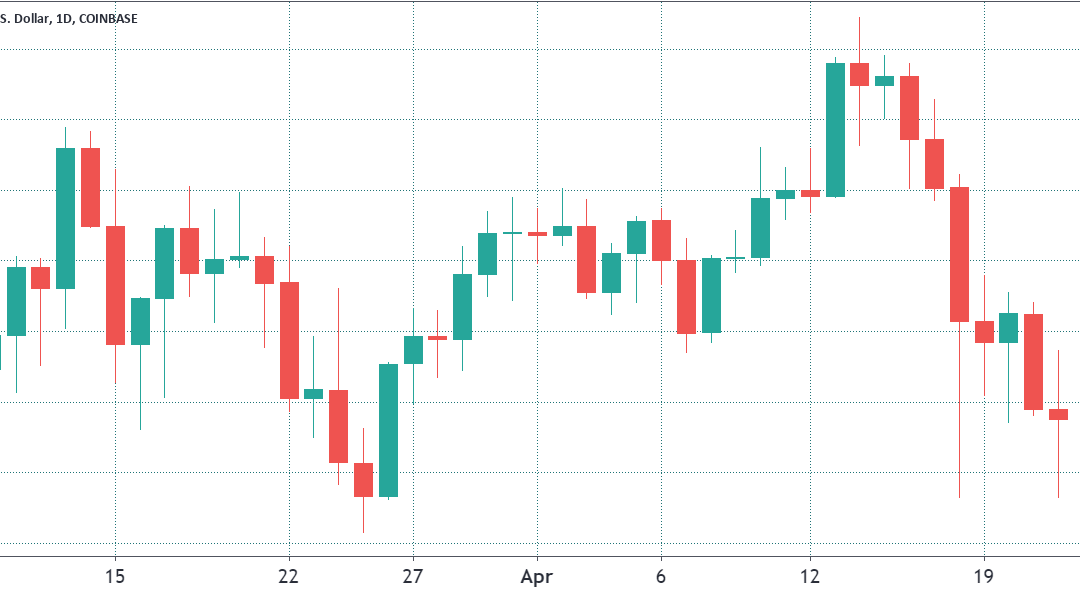
Bitcoin (BTC) has been bouncing at the $51,000 support for the past 44 days. Typically, this would be interpreted as a positive occurrence, especially considering that the $50,000 level represents a 75% advance in 2021.
However, cryptocurrency investors are typically short-term-focused and always overly optimistic. Thus, the current narrative for Bitcoin is slowly turning bearish but aside from sentiment, what story are the fundamentals telling?
However, there is a possibility that the recent drop has its roots in the $1.55 billion options expiry set to occur on April 23. As previously reported by Cointelegraph, bears have a $340 million advantage below $57,000. That could also explain why pro traders kept a neutral stance despite the 18% dip over the past eight days.
On the other hand, some analysts such as Willy Woo have said that the Chinese coal mining accident caused the violent drop in Bitcoin’s hashrate. This event, plus the electricity outage in China’s Xinjiang region, may have reduced the Bitcoin network’s processing power by 19%, and it exposed its heavy dependency on coal-driven energy.
While critics jumped in to bash Bitcoin, Coin Metrics co-founder Nic Carter produced a well-researched rebuttal to some of the key claims. Carter points out that Bitcoin mining, which is relatively portable, is concentrated in areas where electricity is unused and cheap.
Moreover, while the gold industry is environmentally destructive and diesel energy-dependent, Bitcoin mining can be fully powered by clean energy. Unlike precious metals, Bitcoin miners’ portability allows the use of previously wasted oil and gas resources.
Whatever the case, pro traders haven’t been adding positions during the recent BTC price correction.
Pro traders aren’t selling but are also not buying at any price level
Major cryptocurrency exchanges provide data on their top traders’ long-to-short net positioning. This indicator is calculated by analyzing clients’ consolidated positions on the spot, margin, and futures contracts. By doing this, it provides a clearer view of whether professional traders are leaning bullish or bearish.
It is important to note that there are occasional methodology discrepancies between various exchanges, so one should monitor changes instead of absolute figures.

The chart above shows that top traders increased their exposure between April 14 and April 17, while the Bitcoin price was above $60,000. On the other hand, over the past five days, these whales and arbitrage desks remained relatively flat.
It is worth noting that the current 1.49 ratio favoring longs on OKEx remains lower than the 1.75 level seen on April 17. This data signals that top traders reduced their positions over the past five days.
A similar trend took place at Binance, where top traders net long-to-short ratio peaked at 1.25 on April 17. Albeit slightly favoring longs, the current 1.18 indicator sits at the lower range of the past three weeks.
Lastly, Huobi top traders added long positions between April 14 and April 18, but they kept a steady 0.90 ratio.
Therefore, there is no doubt that whales and arbitrage desks are not adding to their long positions even as BTC tests the $52,000 support with a 20% correction from the April 14 peak.
However, investors are encouraged to wait for Friday’s options expiry before jumping to any fast conclusions.
The views and opinions expressed here are solely those of the author and do not necessarily reflect the views of Cointelegraph. Every investment and trading move involves risk. You should conduct your own research when making a decision.


