The moving average is a stock indicator commonly used in technical analysis that helps create a constantly updated average price.
A clear grasp of moving average (MA) is crucial in better understanding the golden cross and the death cross. Generally, MAs are calculated to determine the trend direction of an asset or to identify its support and resistance levels.
The MA is a technical indicator that refers to the average price of a specific asset over a defined period. MAs indicate whether the asset is trending in a bullish (positive, upward) direction or moving in a bearish (negative, downward) direction.
MAs provide useful signals when trading cryptocurrency charts in real time. They can also be adjusted to different periods, such as 10, 20, 50, 100 or 200-day periods. Such periods highlight market trends, making them easily identifiable.
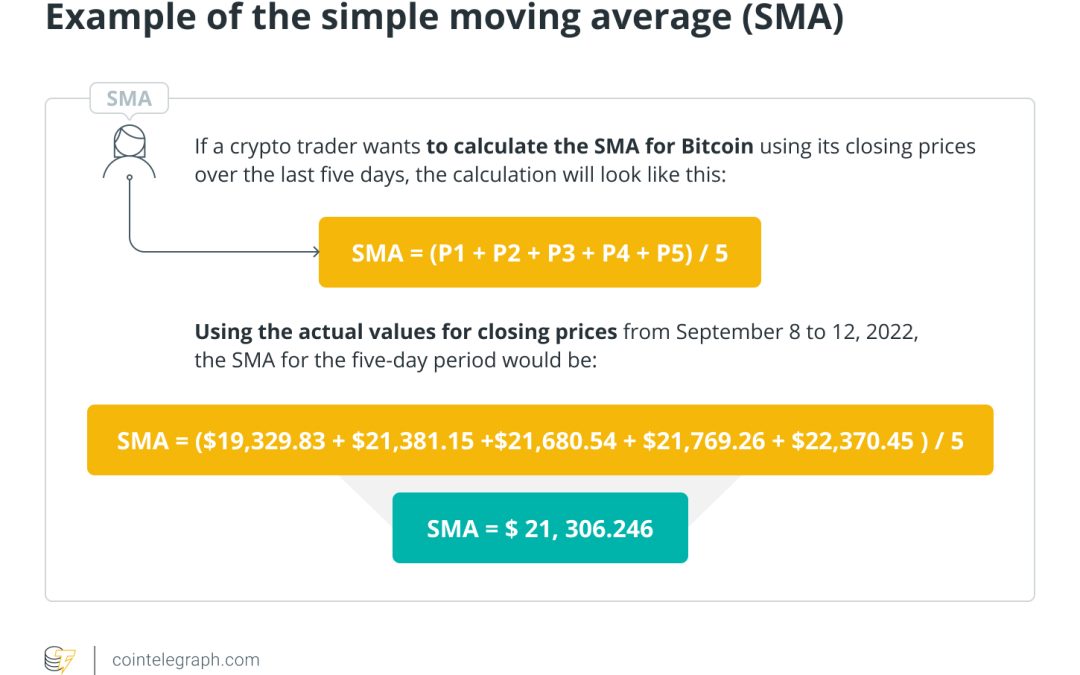
Traders also use different types of MAs. The first is the simple moving average (SMA), which takes an asset’s average price over a certain period divided by the total number of periods.
Another is the weighted moving average, which, as the name indicates, assigns more weight to recent prices. This makes the value more reflective of recent changes in the market. An exponential moving average, on the other hand, while attributing more weight to recent prices, does not remain consistent with the rate of decrease between a specific price and the price before it.
Moving averages, also called “lagging indicators,” are based on historical prices. Traders use MAs as signals to guide them in buying and selling assets, with the 50-day and 200-day periods being the most closely watched among crypto traders.


