Bitcoin’s (BTC) price declined by 8% this past week as sell-off pressure continued to cap buyers. The benchmark cryptocurrency even touched a low of $31,025 on Coinbase.
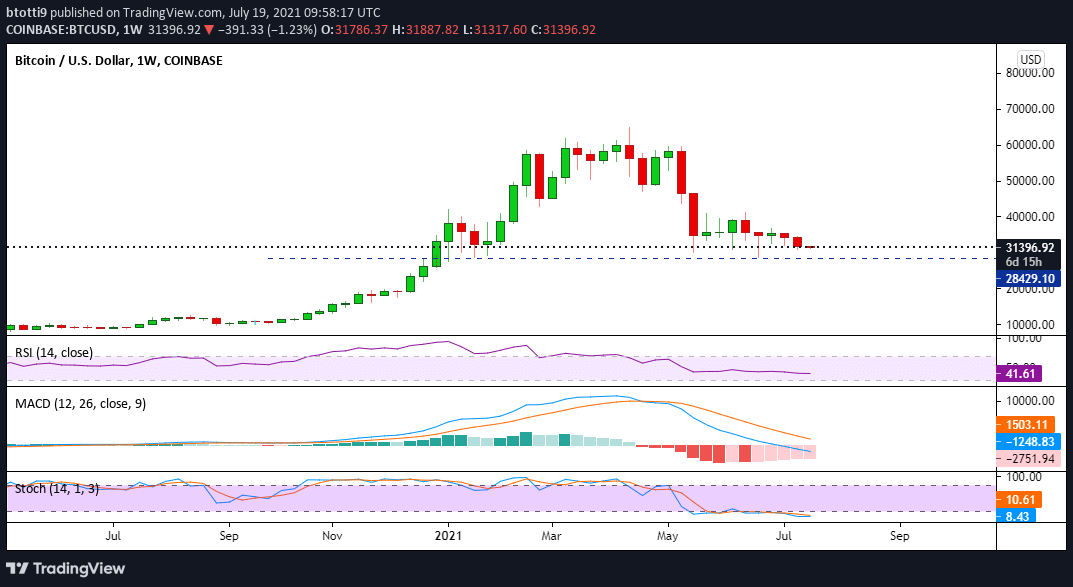
On the weekly chart, BTC recorded a candle close of $31,788, the lowest the cryptocurrency has seen since the penultimate week of 2020.
As of writing, Bitcoin is trading near $31,400 and although it could yet rebound off support at $31k, it remains weak as technical indicators suggest further pressure in the near term.
BTC price outlook
Last week, the BTC price dropped and posted a bearish candle for the second week running. It’s also now four out of five in the red over the last few weeks. The decrease saw BTC/USD sink to a weekly low of $31,025, and eventually a weekly candle close that’s the lowest since the $26,258 recorded during the week of December 21-28 last year.

Technical indicators support a short-term bearish continuation. The weekly RSI is below 50 and sloping, while the MACD continues to trend lower after a bearish crossover. A look at the Stochastic oscillator reveals a similar outlook, with the indicator in the oversold territory after recently forming a bearish cross.

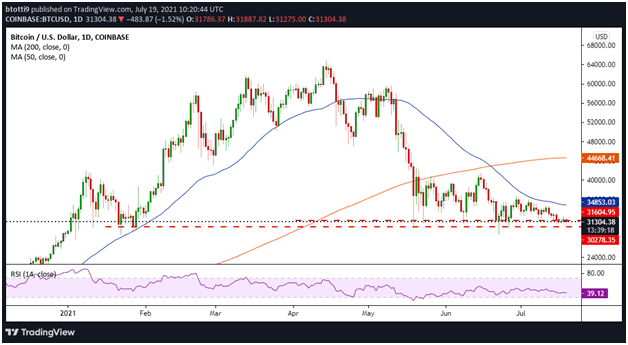
On the daily chart, Bitcoin remains capped below the 50-day moving average (50 SMA) after forming a death cross on 19 June. The daily RSI also suggests bears have the upper hand.
BTC/USD is now below a long-term horizontal support line formed at the $32,050 zone. It’s also below short-term horizontal support at $31,604. If the price falls below $31k, support is likely at $30,278 and possibly $28,400.
On the upside, bulls could push above $32k and target fresh gains around $32,800-$34,880.
The post BTC price outlook: BTC/USD below $32k as weekly close hits YTD low appeared first on Coin Journal.


