Bitcoin (BTC) is in a tight battle between bulls and bears and the network is now reacting, data shows.
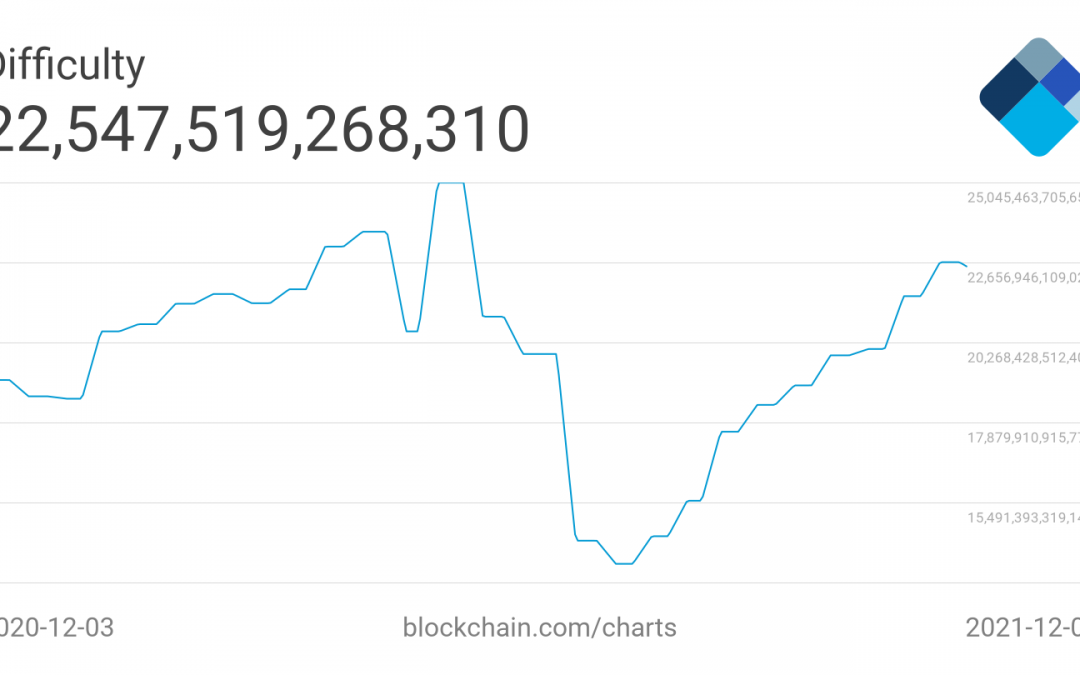
Trackers reveal that this week, Bitcoin difficulty snapped an 18-week green streak to post its first decrease since July.
Difficulty adjusts to 20% BTC price dip
Amid cyclical short-term price action, concern remains that Bitcoin is not done retracing from its latest $69,000 all-time highs.
Having surprised analysts and even rejected one lifelong price model, BTC/USD over the past month feels like uncharted territory — despite roughly doubling year to date.
“With Bitcoin now over 20% below the all-time-high, headlines in traditional media have declared that Bitcoin has entered a bear market,” on-chain analytics firm Glassnode summarized in its latest weekly newsletter, “The Week On-Chain.”
“However it may surprise some readers that this current market correction is actually the least severe in 2021. Some might even say business as usual for a Bitcoin HODLer.”
Nonetheless, network fundamentals are now taking the latest dip into account. On Sunday, difficulty fell 1.5% — after rising continually for nine straight periods. The next adjustment is currently slated to produce a further decrease of nearly 2%.
Long-term holder spending sparks “uncertainty”
Surveying the landscape, Glassnode did not rule out further price declines.
Related: Bitcoin tests traders’ nerves as analyst reissues $400K BTC price forecast
A combination of long-term holder selling, high open interest on derivatives markets and other phenomena could spark a continuation of the downtrend to new local lows.
“Open interest leverage in options and futures at or near ATHs, which is cause for some concern regarding heightened ‘flush out’ potential. Funding rates suggest an only slightly positive bias, making both a long- or short- squeeze plausible scenarios,” it concluded.
Regarding LTH behavior, it added:
“Long-Term Holders have distributed 5.8% of the supply accumulated since March and some uncertainty exists based on their spending patterns.”

Discussing open interest, meanwhile, analyst Willy Woo noted that in a post-ETF environment, activity may just remain higher and not necessarily signal turbulence on the horizon.
“IMO it doesn’t necessarily need to be flushed,” he tweeted.
“It could be a sign of the time with and uptake of the cash and carry trade post futures ETFs.”
BTC/USD circled $56,000 at the time of writing Thursday after spending the past 24 hours repeating a run to $59,000 and subsequent rejection.


