Bitcoin (BTC) price could dip to $18,500 if it fails to hold above the 100-SMA on the hourly chart
Bitcoin price has traded to intraday highs of $19,553, with buyers’ likely focus being a higher daily and weekly close. While this move will add to the overall bullish momentum, a downward flip below $19,150 (the hourly 100 simple moving average) could see BTC/USD correctly sharply to prices around 2 December lows of $18,347.
The bearish outlook is likely if Bitcoin continues to face strong headwinds around $19,500 and intraday highs.
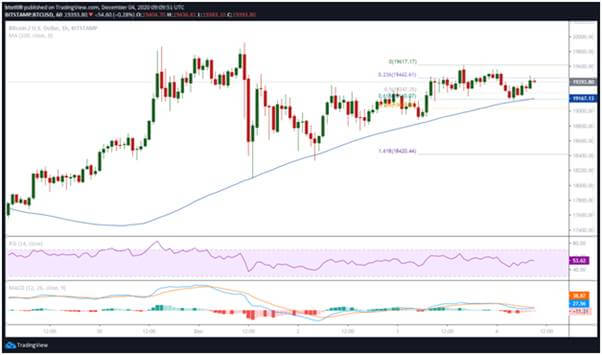
At the time of writing, the 23.6% Fibonacci retracement level of the upswing from $18,851 low to $19,600 high provides immediate resistance at $19,433.
The initial support is at the 50% Fibonacci retracement level at $19,227, which is likely to stem an immediate downside. The 1-hour chart also suggests a bullish trendline is forming, with the support base at around $19,200.
If bulls fail to hold prices above the trendline’s anchor level, Bitcoin’s price could dip to the 100 hourly-simple moving average at $19,158.
BTC/USD 1-hour chart. Source: TradingView
If BTC/USD breaks below the 100-SMA support on the hourly chart, the correction that is likely to follow will push prices to $18,500.
The technical outlook has the hourly MACD suggesting that sellers are losing their momentum. The indicator, however, remains within the bearish zone. The hourly RSI is also turning south and could suggest bears are strengthening if it dips below the 50 point level.
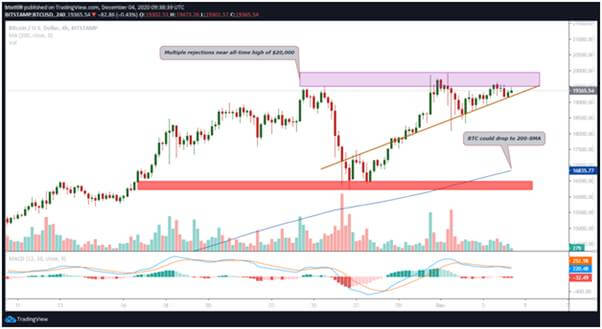
The 4-hour chart also suggests a bearish outlook for the BTC/USD short term. The benchmark Bitcoin pair BTC /USD has had multiple failed attempts above $19,500 and the trend looks likely to repeat if prices dip below the trendline of a bearish rising wedge pattern.
A breakdown from the rising wedge could see Bitcoin’s price drop below $18,000. The downside to the 17,000—16,800 area (the latter has the 200-SMA) could offer an opportunity for re-accumulation before bulls establish another uptrend.
 BTC/USD 4-hour chart. Source: TradingView
Currently, Bitcoin price remains well above the 100-SMA and a fresh increase in buy-side pressure could see it retest the $19,500 resistance level. A clear break above this level will add to the upward momentum towards $19,800. With the market still bullish, BTC price closing above $20,000 would strengthen the push to $22,500.
The post Bitcoin price retests $19,500 but bulls face downward pressure appeared first on Coin Journal.


