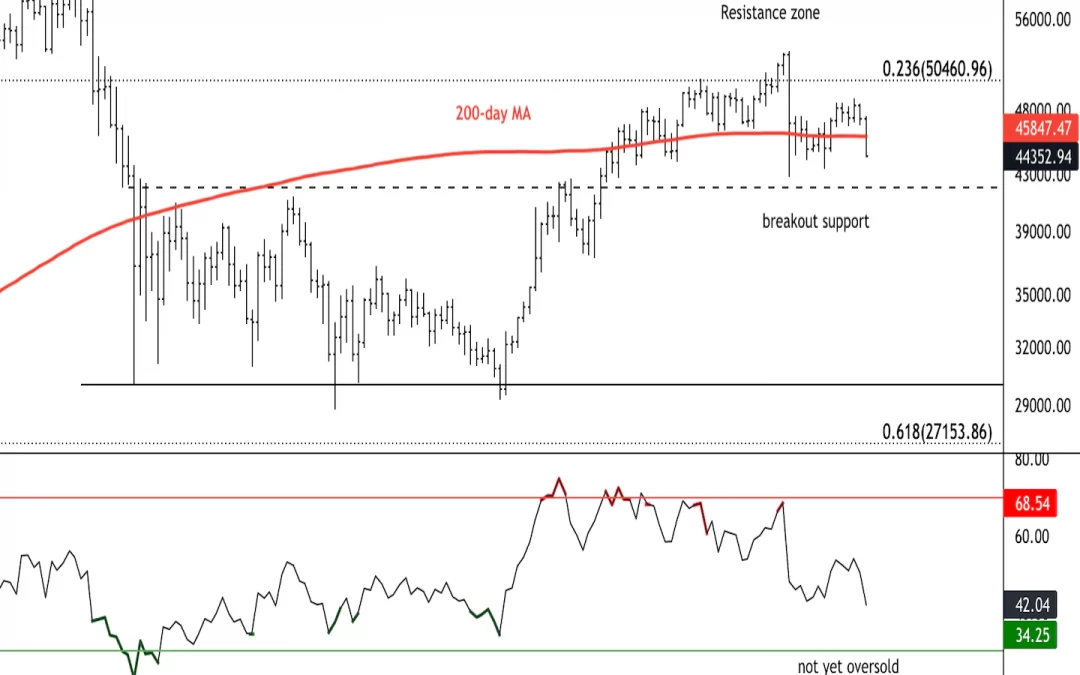
Bitcoin (BTC) sellers were active over the weekend as the cryptocurrency’s price dipped below the 200-day moving average at $45,000. Initial support is seen between the $40,000-$42,000 range where a breakout occurred on August 6.
The $50,000 resistance level was tested several times over the past few weeks, although buyers ultimately took profits as overbought signals appeared on the charts. BTC was trading around $44,200 at press time and is down 5% over the past 24 hours.
- The relative strength index (RSI) on the daily chart dipped below the 50 neutral level and is not yet oversold. This suggests a period of consolidation could persist between $40,000 support and $50,000 resistance.
- On the four-hour chart, the RSI is the most oversold since September 8, which preceded a brief price bounce after a 19% sell-off.
- Short-term buying could occur, although upside appears to be limited beyond $50,000 given strong overhead resistance.


