Bitcoin’s scalable cousin suffered badly from May’s crypto crash — is now a buying opportunity?
Bitcoin Cash (BCH) hard-forked from Bitcoin in 2017 amidst concerns over the latter’s scalability potential. It functions as a peer-to-peer digital cash which aims to become a commonly-used mode of payment for online and offline merchant transactions, across the world.
Last month’s massive crypto crash brought BCH down from a high of $1670 on May 12 to a low of $440 on May 19. At the time of writing, it is consolidating well, looking for its next rebound upwards.
Here’s a quick overview of BCH’s recent and ongoing price movements to help you make a well-informed estimation of its price by June’s end.
Bitcoin Cash Price Analysis
As mentioned earlier, BCH was trading at $584. Looking at the BCH/USD price chart, it is fairly evident that the crypto has been witnessing a constant bull-bear tug of war since May 20th, coiling into a triangular pattern, seeking its next big push.
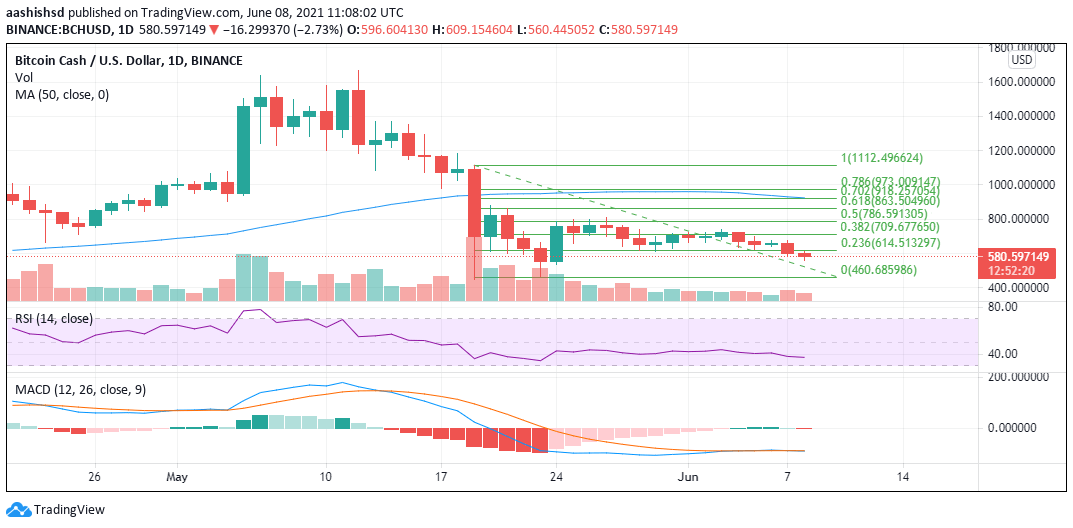
It started the month well, looking good to break out from the Fibonacci resistance level of $786 on June 3. However, Elon Musk’s late night tweet on the same day, about having lost interest in Bitcoin, got the bears into action. Resultantly, BCH breached support near $710 and found lows of $635 and $622 on June 4 and 5 respectively. BTC and BCH, having their origins in the same blockchain and based on similar fundamentals, have a fairly strong correlation with each other. Therefore, any factor that moves the BTC price, is bound to impact BCH too, in the same way.
BCH/USD Daily Chart. Source: TradingView
BTC, as well as BCH, responded mildly to the mixed economic data emerging from the US over the June 4 weekend. No significant adverse effects were witnessed despite an indication that Fed is likely to take aggressive measures going forward and have a cautious outlook towards the US economy, both of which don’t bode very well for the BCH, BTC, and other altcoins going forward.
The coin looked under enough downward pressure to break-out of yet another support at $614 (FIB 0.236), which it did on June 7, closing the day’s candle at $597. The MACD has stayed almost overlapped with the signal line for the first week of June, with RSI also well below the 50 mark, aligning with the bearish trend.
Bitcoin Cash Price Factors For June
There are several factors that could influence the price of Bitcoin Cash in the month of June. Here we will explore a few of these.
U.S. Inflation Ramping Up
Apart from all the technicals detailed above, there are also a handful of external factors which may influence the Bitcoin Cash’s price trend in the month of June 2021. The first is the updated data on the US Consumer Price Index (CPI), expected to be released June 10. Analysts believe that this data will reveal American CPI’s rise to around 4.7% in March, with the core CPI having crossed 3%. A stronger inflation figure will inevitably make the Fed adopt a more hawkish approach, negatively impacting all cryptocurrencies.
China Crypto Crackdown
A lot will also depend on how the crypto crackdown unfolds in China for the remaining part of the month. Bitcoin as well as many other cryptocurrencies saw a drop on Sunday, June 6, amidst concerns related to further strict measures against the industry in China. It mainly emanated from a Goldman Sachs report suggesting a long road for institutional adoption of cryptocurrencies, and Weibo, the Chinese social-media giant suspending crypto-related accounts. More such news stories going forward can give a significant boost to the bearish movements.
Bitcoin Flipping Bullish?
Alternatively, Bitcoin Cash could be buoyed by Bitcoin’s recent tentative recovery. Bitcoin has now been adopted as legal money by the country of El Salvador, and this news has been accompanied by bullish price action. Along with other bullish news indicators like how a $7.5 Billion Hedge Fund (SkyBridge Capital) recently endorsed Bitcoin and crypto, over gold, this development could have a significant positive impact on the value of BCH and other altcoins.
Bitcoin Cash Price Forecast
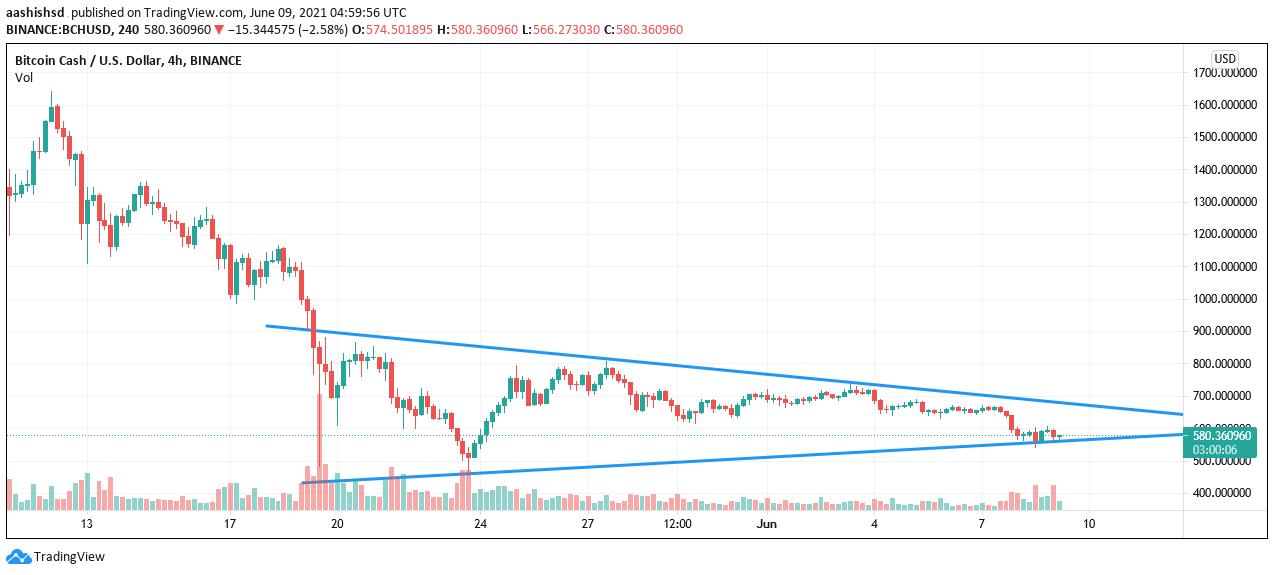
The first week of June has mainly been a period of consolidation for BCH, with the market engaged in a bull-bear battle to break out from the existing levels, into a possibly upward bullish trend. It has led to the creation of a symmetrical triangle with closing prices oscillating between $600 and $720. It’s the first clear structure to have formed on the chart post the May 19 correction last month.

BCH/USD 4-Hour Chart. Source: TradingView
There’s a clear bearish pattern emerging, with a good possibility that the currency may soon break out lower, as the triangle heads into its confluence zone. The MACD slightly breaking out from the signal line, into the region below it, after a week-long overlap; RSI below the 35 mark; and the past two weeks’ candles (till June 8) being well under the 50 SMA, all confirm a BCH/USD downward trend.
If the bears continue their run we may see the FIB 0 major cushion at $460 getting breached, putting the market into the reversal mode and further testing the late Feb 21 lows. Hence, bears must keep a close eye on the $614 and $460 support levels.
Bulls on the other hand can take heart from the fact that such consolidations, narrowing down into a triangle, often rebound from a support level, followed by an upward trend. There’s a very good possibility of this happening, and BCH potentially retesting the $710 resistance at FIB 0.382, and opening up a path for further gains above $800. Beyond that point, legitimate targets exist in the $900 to $1000 regions, before making a push for early May highs in the $1500 range.
Please note, the details provided above are entirely a personal opinion of the writer, derived from relevant market data. None of these are meant to be taken as direct investment advice.
The post Bitcoin Cash Price Prediction for June 2021 appeared first on Coin Journal.


