Bitcoin’s 4-hour chart suggests a bearish reversal in the shape of a descending triangle pattern
Bitcoin has slipped towards $31,000 again after aggressive bear action over the past 24 hours. The price of BTC rose to an intraday high of $34,888 before a swift rejection near the critical $35k level sent to lows of $31,137.
BTC price is currently about 6% off its 24-hour opening and could see a further decline if buyers do not join the party over the next few sessions. On the contrary, Bitcoin is likely to rally higher as a bullish continuation pattern unfolds on the daily log.
BTC/USD bearish reversal setup
Bitcoin’s sell-off to $31,137 has seen bulls struggle to establish any sort of momentum above $32,500.
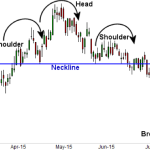
The 4-hour chart shows that BTC/USD has printed a series of higher lows, with price action on the downside anchored by a horizontal support line. In technical analysis, the above scenario represents a bearish reversal pattern in the form of a descending triangle.
For a bearish reversal to occur, an asset’s overall price action needs to be in an uptrend. The price then fails to break above a declining trendline, with the higher lows shrinking as the price range falls. If prices break below the horizontal support line, they are likely to continue falling until buying pressure stems the rot and a new uptrend begins.
Typically, the range of decline corresponds to the height of the triangle.
BTC/USD 4-hour chart showing potential bearish reversal. Source: TradingView
As shown on the chart, BTC/USD could drop as low as $20k if sellers push it below $30,000 and the previous major support level at $28,800.
Bitcoin’s price has dropped 14% over the past seven days but could dive nearly 35% if it breaks below $30k. This could see prices drop to lows of $20,500.
Notably, the decline suggested by the bearish continuation pattern can be invalidated if prices break higher before or upon reaching the apex of the triangle.
BTC/USD bull case
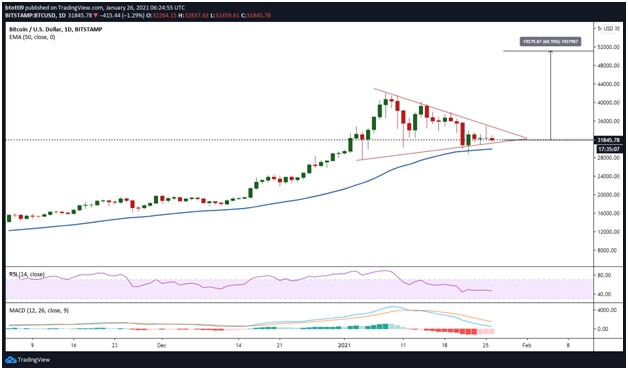
While the 4-hour chart suggests further sell-off in the short term, focusing on the daily chart gives a slightly different outlook for Bitcoin in the near term.

BTC/USD daily chart with a potential bull pennant. Source: TradingView
As seen, the candlestick pattern consists of higher lows and lower highs. The trend formation with this type of action suggests BTC price is in a symmetrical triangle pattern. Since it follows a massive uptrend, the cooling-off suggests a bull flag formation.
This is a bullish continuation pattern, which in the case of Bitcoin, suggests the potential for a massive upside breakout if there’s confirmation.
To measure the extent of the upside, technical analysts look at the height of the flagpole. From the above chart, BTC/USD could rally more than 60% towards highs of $50,000 in the near term.
BTC/USD is trading at $31,902 at the time of writing.
The post Bitcoin (BTC) chart setup suggests fresh declines below $30k appeared first on Coin Journal.


