Binance Coin (BNB) price could decline below $40 if bears breach the lower trendline support of the ascending wedge pattern the coin has formed
So far this year, BNB has followed the macro trend seen across the wider crypto market.
For instance, its price rallied to a new high this past week at a time when Ethereum, Polkadot, and Aave also led the market with spectacular gains. The mini altcoin party followed Bitcoin’s meteoric rise to $42,000.
Binance Coin has also seen a swift correction, as have most of the top ten altcoins. At the time of writing, BNB is trading at $40.69, nearly 14% down from its peak of $47.21 on 19 January.
While bulls are likely to exert more upward pressure, the current weakness could see BNB’s price slip below $40, risking further correction. A positive move from current price levels on increased demand could help absorb the potential short-term rot likely driven by momentum traders.
BNB/USD
BNB bounced off support at $38.60, broke above the 20-day EMA, and touched intraday highs of $43.38. However, seller congestion has now pushed prices lower again, with bulls fighting to keep the support of the 20-day EMA at $41.12.
If bears manage more damage, BNB/USD could break below a major support line at $40.38 (previous resistance-turned-support line marked by the 0.382 Fibonacci retracement level).
The downward pressure is likely to weaken bulls and push the BNB/USD pair towards the support line of an expanding rising wedge pattern.
BNB/USD daily chart. Source: TradingView
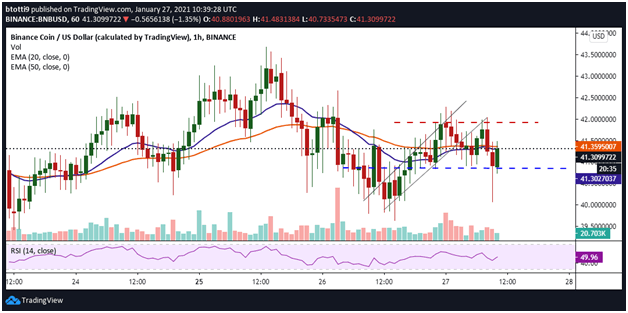
The hourly chart also shows BNB has broken below both the 50-day EMA ($41.30) and 20-day EMA ($41.35). If the price breaks higher, bulls need to hold onto gains above the immediate resistance zone at $42.00. The hourly RSI supports the upward trajectory as it begins to slope higher from below the midpoint.

BNB/USD 1-hour chart. Source: TradingView
On the other hand, a reverse below the support line (blue, dotted) would see BNB/USD risk further declines as mentioned above.
Notably though is that the RSI indicator on the daily chart remains above the midpoint, meaning that bulls might have a slight advantage over the sellers.
To turn positive, bulls need to keep prices above the 20-day EMA ($41.12). That will allow them to target $43.58 (0.236 Fib level), likely invalidating the bearish outlook if bulls sustain the momentum to retest the all-time high price above $47.00. The buy-side pressure could then propel BNB towards $50.
The post Binance Coin price analysis: weakness on the horizon for BNB appeared first on Coin Journal.


