- The AVAX price receives dynamic support from the 20-day EMA line.
- In the daily chart, the RSI slope indicates a significant rebound.
- The AVAX Network coin’s intraday trading volume is $1.81 million, representing a 20% loss.
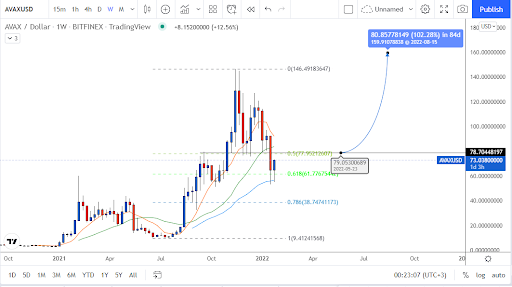
The price of AVAX had a substantial drop in January. The coin’s value plunged by half in less than a month to $53.6. This collapse has been extended by the recent relief rally in the AVAX/USD combination, which has created an inverted flag pattern.
The AVAX price demonstrated a relief bounce to the $97 barrier. However, the crypto market’s abrupt sell-off breached the 200-day EMA and 50 percent Fibonacci retracement, bringing the coin’s price down to $53.
The bearish onslaught has been halted by a common support zone of $53 and 0.618 FIB level, which has sparked a retest of the 200-EMA. If sellers can keep the AVAX price below $76 for an extended period, the coin’s price will continue to fall.
The RSI slope has quickly recovered from the oversold zone due to recent price surges. The slope has passed above a resistance trendline and the 14-SMA line, suggesting that coin buyers are becoming more powerful.
 Source – TradingView
Above the $77.8 level, there is a bullish opportunity
On the 4-hour set timeframe graph, the AVAX/USD pair is forming an inverted flag pattern. Once the coin price falls off of the rising support trendline, this bearish continuation pattern might present a good selling opportunity.
Crypto traders may anticipate a decent rebound potential if the ALT price breaks over the joint resistance of $77.8 and the 20-day EMA line. The falling ADX slope indicates a loss of selling momentum. A break out of the price pattern, on the other hand, would set off an upward trend.
The post Avax forms an Inverted Flag Pattern indicating continued Correction appeared first on Coin Journal.


