- CMF at 0.15 signals tentative bullish inflows.
- July 11 saw 220 million XRP hit exchanges; inflows muted since.
- Ascending triangle suggests breakout possible above $3.24.
The XRP price is trading in a narrow band after reaching a monthly high of $3.65 earlier in July. It has since declined by nearly 14% to about $3.09, showing only a modest 5% weekly gain.

However, market indicators and blockchain data now point to a potential reversal. Large wallets are showing signs of quiet accumulation, while exchange inflows remain low.
This combination has created an environment where even moderate buying activity could trigger a breakout if the right conditions align.
CMF indicator shows hidden demand building under $3.24
From 20 to 26 July, the Chaikin Money Flow (CMF) indicator showed a higher low, despite the XRP price declining from $3.60 to $3.09.
This bullish divergence suggests that institutional players or large holders have been steadily accumulating XRP during the pullback.
Currently, the CMF hovers around 0.15. For a stronger move to the upside, the indicator would need to rise further and break its previous high, confirming a surge in positive money flow.
Unlike trend-following indicators, CMF evaluates momentum based on price and volume. Its current behaviour indicates inflows are outweighing outflows, but just barely.
The signal remains tentative, not yet strong enough to confirm a breakout.
A decisive CMF shift above 0.20 could be a leading signal for a more aggressive price advance toward the recent high of $3.65.
XRP inflows to exchanges remain low after July 11 spike
On-chain data reveals subdued XRP activity on centralised exchanges, supporting the case for lower near-term sell pressure.
After a one-time spike on 11 July, when over 220 million XRP were deposited onto trading platforms, inflows have remained low.
By 29 July, the daily exchange inflow had dropped to just 9.7 million XRP, even as the price hovered around $3.12.
Low inflows typically suggest that large holders are not preparing to sell. In effect, this reduces available supply, giving any future demand more impact.
This trend, when combined with the rising CMF, points to a potential supply-demand shift in favour of buyers.
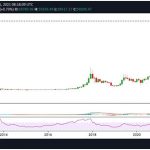
XRP charts reveal ascending triangle near key support zone
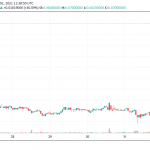
The 2-day XRP chart shows an ascending triangle pattern forming just below the $3.24 resistance line.
This is a bullish formation where price builds higher lows against a flat top, indicating accumulation pressure.
The structure suggests traders are increasingly willing to buy on dips, reinforcing the likelihood of an upward breakout if resistance is cleared convincingly.
Fibonacci levels place immediate support between $2.95 and $2.99. If XRP holds above this zone and breaks through $3.24, the next potential target is the recent high of $3.65.
A successful breakout above $3.65 would likely push the asset into price discovery, where historical resistance is limited.
However, any close below the $2.95-$2.99 support could invalidate the bullish outlook and force a reassessment.
For now, technical momentum and on-chain flows remain neutral to slightly bullish.


