XRP/USD looks vulnerable as bears target break below a crucial 200-SMA support level
Ripple (XRP) bounced to highs of $0.33 on Monday but looks likely to struggle above the $0.30 range once again. This bearish short term outlook follows yesterday’s big-time tumble that saw XRP price drop to lows of $0.22.
The cryptocurrency did manage to recover above $0.30 during the Asian trading session Tuesday, as most cryptocurrencies rebounded off Monday’s sell-off. However, although XRP remains in the green as of writing, it could easily flip red in coming sessions if momentum shifts.
The key level to watch is the critical support line offered by the 200-day simple moving average on the daily chart.
Away from the market, Ripple appears intent on luring the best talent to its team. Yesterday, Ripple CEO Brad Garlinghouse announced that former Amazon executive Devraj Varadhan was hired as Ripple’s new SVP of engineering.
Devraj will help the company develop the infrastructure needed to advance the development of the Internet of Value—“a world where money moves like information on the internet”.
XRP/USD
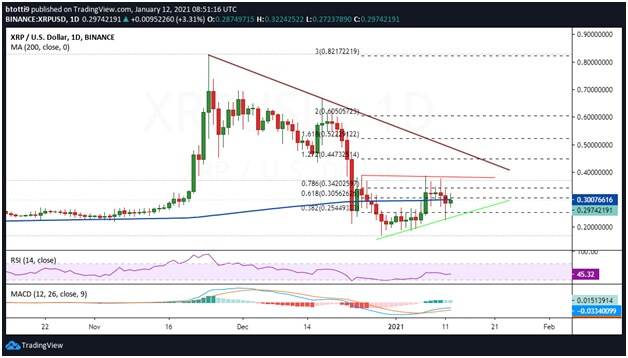
If XRP/USD breaks below the 200-day SMA, it’s likely to extend the losses towards the 38.2% Fibonacci retracement level ($0.25) of the swing low to $0.22. With the Ripple—SEC lawsuit set for February, added downside pressure might push prices to the psychological level of $0.20.
XRP/USD daily chart. Source: TradingView
As the chart shows, the next anchor from here is $0.16, an area that coincides with a crucial two-week support line (green line).
The positive picture on the downside is an RSI that suggests bullish divergence and a MACD looking to strengthen in the bullish zone. If buying pressure intensifies in coming sessions, bulls will likely hold the 200-SMA.
A break above the 61.8% Fib level ($0.305) should allow buyers to focus on the next target at $0.34 (the 76.8% Fib level).
Bulls might need to force their way past a horizontal resistance level (red line), which has capped bulls’ advances since 25 December last year. It also provides for the two latest bearish candles that highlight the dip to $0.22.
If XRP/USD clears the hurdle, a retest of a negative trend line in place since Christmas Day 2020 could see Ripple prices touch the 127.2% Fibonacci retracement level ($0.44.) Down the line, the potential for a textbook cup and handle pattern could propel XRP/USD to a near term target of $0.82 (300% Fibonacci level).
The post XRP could recoil again despite bouncing to the $0.33 range appeared first on Coin Journal.


