XRP price hit intraday highs of $0.263, though bulls are struggling to sustain the momentum
Ripple (XRP), which has for so long underperformed Bitcoin (BTC) and other major alts, traded higher to change hands above $0.263. The upward action was crucial as it meant that the bulls broke above an ascending triangle pattern that has capped prices since XRP/USD plunged from mid – August highs around $0.33.
But the momentum above the resistance line hasn’t held, with the price trading below the triangle pattern. The cryptocurrency, nonetheless, retains a bullish outlook as seen on the daily chart, but XRP/USD needs to close higher to confirm the perspective.
Even then, as traders keep an eye on where XRP trends next, Bitcoin’s movement will also determine the rally.
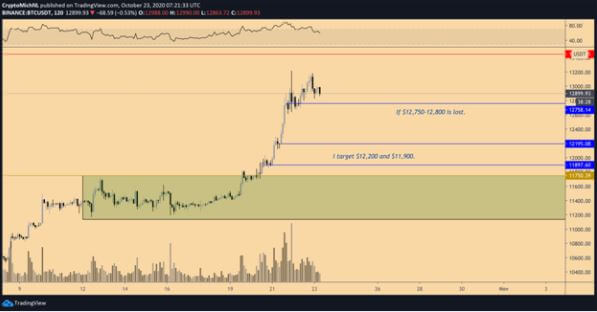
One analyst has shared a chart showing that BTC/USD needs to hold $12,750-12,800 to retain the uptrend momentum towards $13,500.
This is crucial as failure could mean the price pivoting to lows of $12,200 or lower to $11,900.
XRP/USD daily chart
XRP’s breakout to intraday highs above $0.263 was critical as it has given bulls the impetus to keep prices above the 100 – SMA. Keeping bears at bay around this resistance turned support area near $0.254 is even more important.
Importantly, the formation of a hidden bullish flip in the moving average convergence divergence indicator should offer further encouragement to buyers. Like the MACD, the RSI is also supportive of an upside as it ticks higher.
As such, if bulls keep prices above the 100 – day moving average, a run to August highs around $0.30 remains a huge possibility.
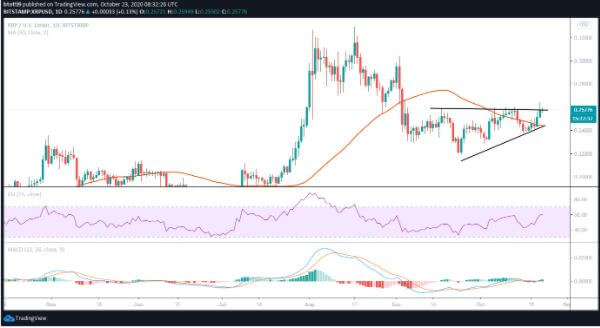
On the downside, a dip below the 100 – SMA opens up a bearish flip to the lower boundary of the aforementioned ascending triangle pattern.
On the 4 – hour chart, XRP/USD has posted a series of higher lows and lower highs in the past five hours. The RSI suggests that the bulls still have control, though, turning lower would flip the advantage towards the sellers.
A similar pattern appears on the 1 – hour chart, suggesting a further weakening of bulls if the downward pressure continues. The 50 – SMA on the daily chart and the 100 – SMA and 200 – SMA on the 4 – hour chart provide refuge at $0.245, $0.251 and $0.246, respectively.
The post XRP breaks above major resistance level appeared first on Coin Journal.

