

- LINK is trading at $12.53, down 7.28% in 24 hours.
- LINK could surge 35% if it breaks $15.68 resistance.
- MVRV Z-score at 3.09 suggests a bullish accumulation zone.
Chainlink (LINK) is trading at a critical level as market data points to heightened volatility and investor activity.
The token, now priced at $12.76, has dropped 7.28% in the last 24 hours.
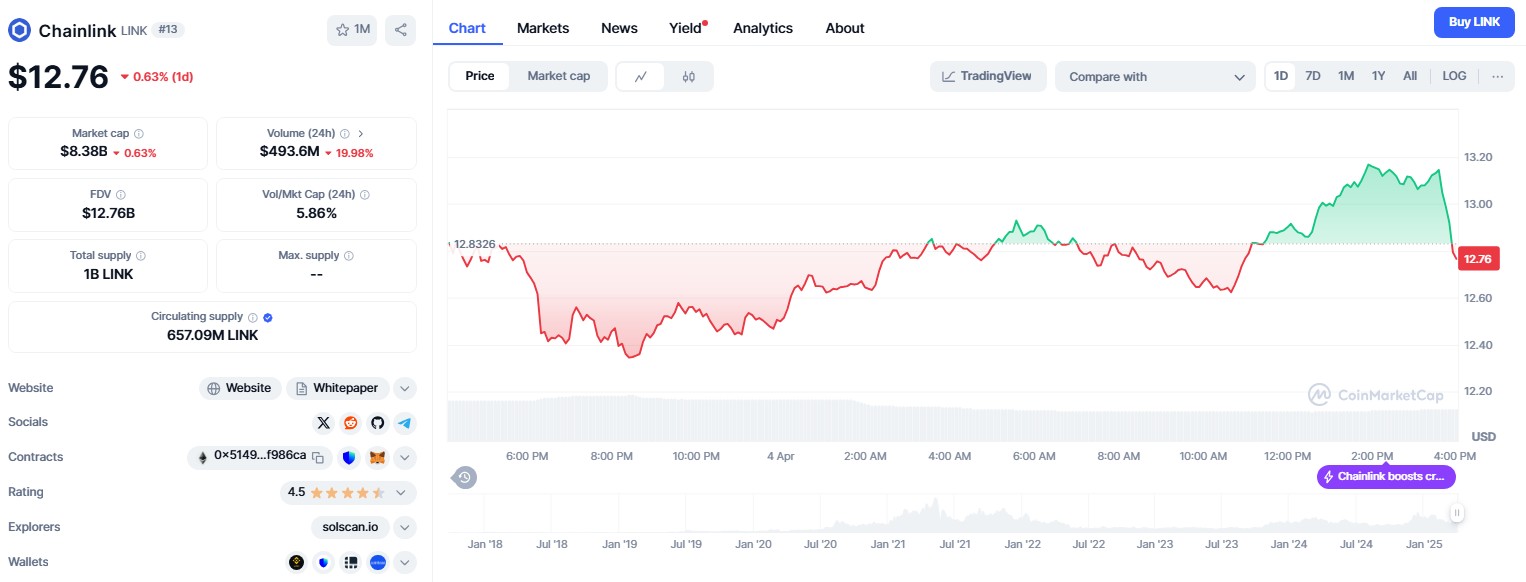
Source: CoinMarketCap
However, technical indicators and whale accumulation suggest the possibility of a significant move.
A major investor recently bought nearly 140,000 LINK for $2 million at $14.30, signalling major interest.
Meanwhile, LINK is forming a symmetrical triangle and descending wedge patterns typically associated with breakouts.
If the price clears resistance at $15.68, it could rally 35% to $18.18.
Whale activity and resistance levels
A large holder recently acquired 139,860 LINK at an average price of $14.30, increasing their total holdings to 147,553 LINK.
This investor previously profited $161,000 from earlier LINK trades, suggesting a pattern of well-timed entries.
These high-volume transactions often signal market optimism and precede price rallies.
LINK is currently facing resistance at the whale’s entry level of $14.30, and $15.68 remains a key level for bulls.
A break above this could trigger a 35% rise, reaching a price target of $18.18.
On the downside, if LINK fails to hold support at $12.57, it could dip toward $11.50.
Chart setup and volatility signals
LINK’s price structure is compressing within a symmetrical triangle and descending wedge, commonly known as a megaphone pattern.
This setup usually precedes large price moves, with increased volatility and potential breakouts in either direction.
At current levels, LINK is navigating a narrow range that has historically led to high-impact swings.
If the price breaches $15.68, traders could see a quick move toward the $18.00 mark.
This would likely be fueled by short-covering and retail buying.
On the flip side, a close below the $12.57 support would break the bullish structure, potentially sending prices lower.
On-chain metrics show accumulation
The MVRV Z-score—a key metric to identify overbought or undervalued conditions—is at 3.09.
Historically, Z-scores between 2 and 3 have preceded major LINK rallies. For comparison, LINK surged over 120% in early 2023 after a similar reading.
In addition, daily active addresses have risen to 921, up from March lows. This signals increased user activity and could support long-term price growth.
Exchange reserves have also dropped 3.11% to $2.15 billion, indicating that fewer LINK tokens are available for immediate sale.
Reduced supply on exchanges typically signals strong holding behaviour among investors.
Liquidity and whale confidence grow
The recent $2 million whale investment has aligned with positive on-chain indicators, including reduced supply and rising address activity.
Together, these form a bullish setup in the face of technical resistance and volatile price action.
If LINK manages to cross the $15.68 resistance, it could rise to $18.18.
The next major resistance level would then be around $20.
External factors like Bitcoin ETF flows and US monetary policy may influence the pace of any rally.
Should LINK fall below $12.57, panic selling could follow, although large holder support may help stabilise the market.


 steals Dogecoin’s thunder")


