- UNI is bouncing off the support of a broadening wedge pattern.
- The 50 EMA offers immediate resistance at $8.17 on the weekly chart.
- Bullish short-term targets above EMA include $11.93 and then $18.62.
A welcome rebound for decentralized finance (DeFi) tokens saw Uniswap price gain 12% in the past 24 hours as bulls reached a one-month high.
The UNI has, in fact, surged to its highest level in over a month, crossing the $7 mark amid renewed market optimism.
Pump.fun and Raydium have also notched double-digit gains, while Hyperliquid, Jupiter, and Aerodrome Finance are registering gains in the 5-7% region in the past 24 hours.
Litecoin and Dogecoin also registered gains.
UNI’s rally signals potential momentum for the DEX protocol as broader crypto sentiment improves.
Uniswap breaks to 1-month high above $7
Uniswap’s UNI token has posted impressive gains.
In the past 24 hours, it has climbed over 12% to reach $7.15, marking its strongest one-month peak since early October.
Over the trailing week, UNI has advanced by 35%, outpacing many altcoins and reflecting heightened trading activity on the platform.

This upward momentum is largely attributed to a broader market bounce.
What’s fueled this is the easing macroeconomic pressures and renewed investor appetite for risk assets following recent volatility.
With trading volume spiking 66% to over $498 million in the last day, UNI’s performance aligns with a growing confidence in DeFi infrastructure as altcoins regain traction.
Analysts note that Bitcoin’s stabilization above $106,000 has lifted liquidity providers and traders alike.
Uniswap price forecast
Technical indicators paint a bullish short-term picture for UNI.
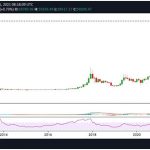
As the token bounces off key support, it is likely to trend up within a broadening wedge pattern.
On the chart below, the Uniswap price has climbed off the lows of formation that often precedes accelerated upside in trending markets.

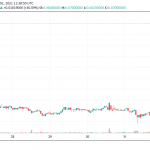
UNI price chart by TradingView
Bulls are now targeting two consecutive green weekly candles, which could confirm sustained recovery and propel prices higher.
Immediate resistance looms from the 50-week exponential moving average (EMA) at $8.17, a level UNI must breach to unlock further gains.
The Relative Strength Index (RSI) is trending up from above 46.
While below the midpoint, it’s within the neutral zone and indicates building momentum.
Bulls will have room to run before entering overbought territory.
Should UNI maintain this trajectory, short-term targets point to $11.93, above the 50-week EMA cluster.
An uptick above this mark will be followed by a more ambitious push toward $18.62.
However, downside risks may see bears target a return to lows of $4.65, a key floor from 2023.
Longer-term forecasts for 2025 remain optimistic.
Amid DeFi expansion, the UNI price could target a breakout to $25 and $42.


