The main hurdles are likely to be around the 20 EMA and then 50 SMA as seen on the 4-hour chart
Uniswap (UNI) is looking to bounce higher after an extended downtrend that had been exacerbated by this week’s crypto sell-off.
The technical outlook for Uniswap price suggests a potential recovery above $20, with a higher close on the 4-hour chart. However, as the RSI, MACD and moving average curves indicate, there’s a possibility that UNI/USD could retest lower zones before rebounding alongside the broader market.
Uniswap price outlook
At the time of writing, UNI price has moved above the $20 level, about 2% up on the hour. Buyers are likely to attempt a retest of $20.52, a hurdle marked by the 0.236 Fib level of the move from $27.60 high to $18.33 low.
If the positive picture strengthens, bulls could target prices around $21.65 and then $23 (0.5 Fib level). A daily close above this area will allow buyers to aim for an extension above $24 (0.618 Fib level).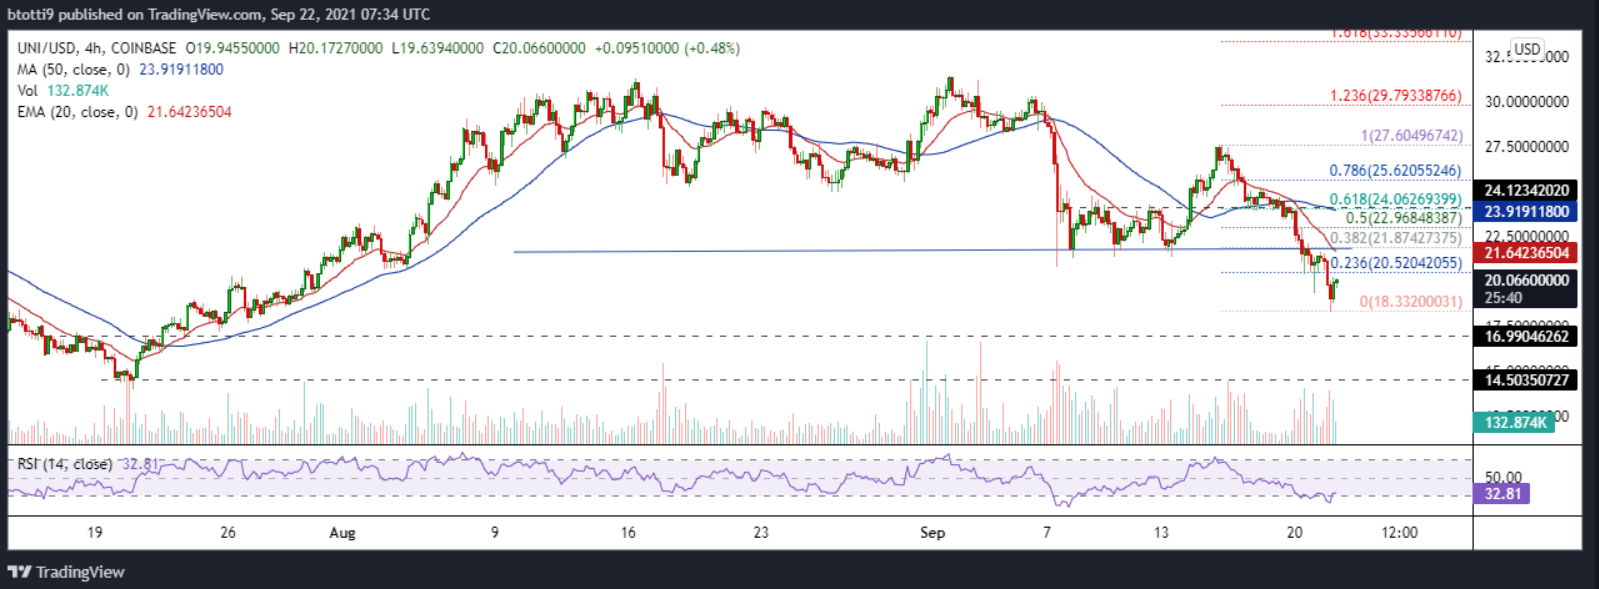
UNI/USD 4-hour chart. Source: TradingView
On the flip side, Uniswap could still struggle to shed the overall bearish picture given the outlook of the 20 EMA and the 50 SMA. The downsloping curves of the moving averages suggest short term strength is with the sellers. This bearish potential also receives support from the RSI staying within the negative zone.
Further adding credence to this perspective is the MACD indicator, which is projecting a struggle for bulls. As seen on the 4-hour chart, the MACD shows a bearish crossover and is below the zero line.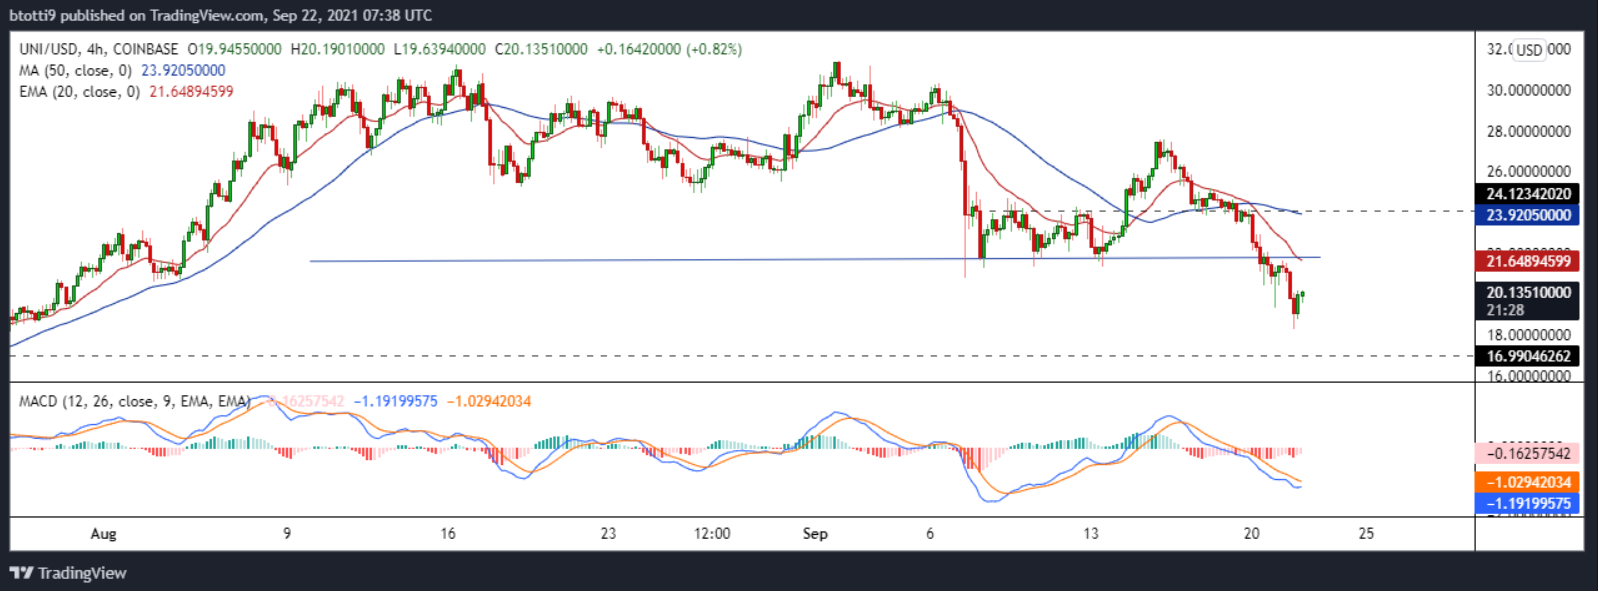
UNI/USD 4-hour chart. Source: TradingView
In this scenario, sell-side pressure could see UNI/USD trade lower. Key support levels are at $18.30 and $17, with further losses likely to see bears aim for July lows around $14.50.
The post Uniswap price analysis: UNI looks to break downtrend as price bounces above $20 appeared first on Coin Journal.

