Traders use various technical analysis tools to identify emerging trends and profitably trade that direction. One popular trend-defining pattern that traders often rely on is called the price channel.
An ‘ascending channel’ or a “bullish price channel” is formed by drawing parallel lines between the perceived support and resistance levels that an asset trades between on candlestick charts.
Ascending channel basics
An ascending channel is formed when the price action can be contained within two upward sloping parallel lines. First, the main trendline is drawn by joining the two reaction lows. Then a parallel line is drawn by connecting two reaction highs. This line is called the channel line.
The main trendline is the support area from where the price rebounds and the channel line acts as the resistance from where the price turns down. Generally, the price oscillates between these two lines. As the price continues to rally inside the channel, the ascending channel is considered bullish.
In the chart above, the two reaction lows (marked as ellipses) can be joined to form the main trendline. Ideally, for the channel line, two points are needed but for early identification of a channel a parallel line with just one reaction high can also be drawn.
As seen above, the price rebounds off the main trendline and turns down from the channel line. This means that traders buy near the main trendline and sell when the price reaches the channel line. The price action inside the channel could be random and it does not follow any set pattern.
As the price continues to rise inside the channel, it shows that the trend is bullish. Traders use corrections to the main trendline to buy because it offers a low-risk entry opportunity.
A breakout of the channel signals a pick-up in bullish momentum, while a break below the channel indicates a possible change in trend.
A break below the channel does not always result in a downtrend because sometimes, the price remains range-bound for a few days and then resumes the uptrend.
Ascending channel breakouts

The chart of FTX Token (FTT) shows an ascending channel where the main trendline was drawn by joining the two reaction lows. A parallel line from the reaction highs was used to draw the channel line.
As shown in the chart above, the price largely remained inside the channel from December 2019 to mid-December 2020. Corrections near or to the main trendline could have been used as a low-risk buying opportunity by keeping a close stop-loss.
Usually, a breakout of the channel indicates that the bullish momentum has picked up but in this case, the breakouts turned out to be bull traps on two occasions. The first close above the channel line on Aug. 30, 2020, returned inside the channel on Sep. 3, 2020.
Another close above the channel on Nov. 30, 2020, failed to attract buyers at higher levels and the price re-entered the channel on Dec. 1, 2020. This shows that there is no certainty in trading, hence traders should always use a stop-loss to protect their positions.
Finally, on the third attempt, the price broke out of the channel on Dec. 16, 2020, and the bulls defended the retest of the breakout level between Dec. 20 to Dec. 24. This meant that the previous resistance had flipped to support and the bullish momentum was about to pick up.

A breakout from an ascending channel, if sustained, shows the pick-up in momentum. That usually results in a stronger rally. The target objective can be calculated by adding the height of the channel to the breakout level.
In the above case, the height of the channel is $1.15. Adding that to the breakout level at $4.70 gives a target objective at $5.85.
However, the rally turned vertical and quickly reached $10.10 on Jan. 7, 2021. This shows that the target objective should only be used as a guide and other supporting indicators should be looked at before closing the position.
Ascending channel breakdowns

The FTT/USDT pair again formed an ascending channel and the price rose from about $20 to $63.10 inside the channel. After the sharp rally, the price broke below the channel on May 17. The bulls tried to push the price back into the channel on May 18 but failed.
This attracted strong selling and the pair started a downtrend. The depth of the channel is $14.90 and the breakdown happened at $50.56. Subtracting the depth of the channel from the breakdown level gives a target objective at $35.66.
However, the downtrend continued and the pair hit $21.89 on June 26. This shows that traders should turn cautious when the price breaks down from the channel.
Not all breakdowns result in a prolonged downtrend

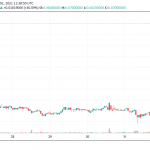
In the above example, Bitcoin (BTC) traded inside an ascending channel from April 2020 to early-June, 2020. The price broke below the main trendline of the channel on June 11, 2020, but the BTC/USDT pair did not start a downtrend.
Instead, the price traded inside a range for a few days and then resumed its uptrend. This shows how a break below the channel does not always result in a downtrend. Traders should watch other supporting indicators and the price action before turning bearish.
Key takeaways
An ascending channel hints at the early stages of a stronger uptrend and it offers an opportunity for traders to buy on dips to the main trendline.
A breakout of the channel usually indicates a pick-up in momentum, resulting in a sharp rally. It is usually better to wait for a successful retest of the breakout level to establish fresh positions because sometimes a breakout turns out to be a bull trap.
When the price breaks below the channel, it is a sign that the uptrend has ended but that does not always result in a downtrend. Sometimes, the price trades in a range after breaking below the channel and then as volume picks up the asset begins a new up-move.
Traders should use the ascending channel in conjunction with other technical tools to add further insight to their buy and sell decisions.
The views and opinions expressed here are solely those of the author and do not necessarily reflect the views of Cointelegraph.com. Every investment and trading move involves risk, you should conduct your own research when making a decision.


