Theta could decline to $0.55 in the coming days if bulls fail to battle a sell signal flashed on the daily chart
THETA recently broke above a critical resistance line as increased buying saw bulls rally after see-sawing between $0.55 and $0.70. The uptrend is likely to see the token trade as high as $1.00, although that will depend on how buyers handle a sell signal presented on the daily chart.
THETA price outlook
The short term technical picture for THETA/USD suggests a brief downturn is a more likely scenario.
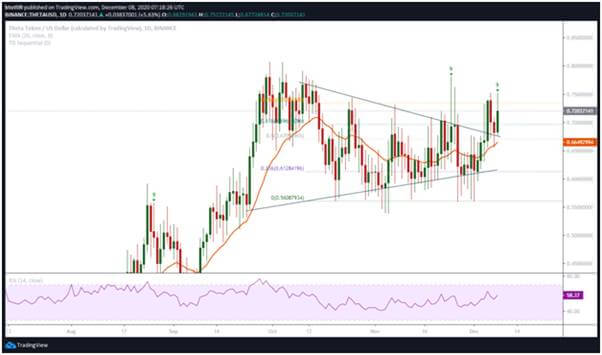
The native token on the video streaming blockchain has recently printed a nine green candle to suggest possible sell-off pressure. The TD Sequential signal is crucial in helping identify potential trend reversal, and in this case, could signal a short-term downside for THETA.
THETA/USD daily chart. Source: TradingView
If the price slips to $0.70, the next stop could be at the 61.8% Fibonacci retracement level of the decline from $0.78 high to $0.55 located near $0.69. The upper trendline of the recently formed descending triangle pattern, the 50% Fibonacci level ($0.67) and the 20-day exponential moving average (EMA, daily) at $0.66 provide further support areas.
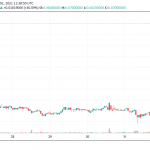
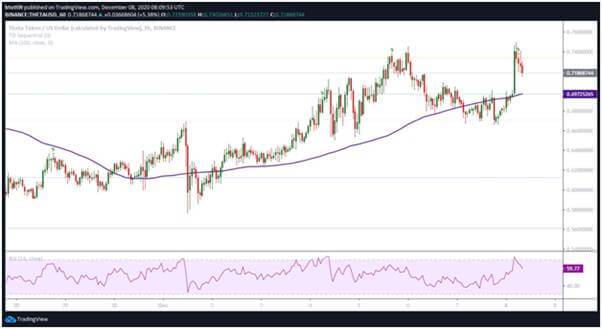 THETA/USD hourly price chart. Source: TradingView
The bearish outlook also presents on the hourly chart, which shows a series of lower lows in the past several hours. The price is looking to dip below $0.71 as the RSI tips from overbought territory to suggest sellers are strengthening. The critical price level on the hourly chart is the 100-SMA at $0.69; the same as the 20-EMA on the 4-hour chart.
Should the selling pressure hold, THETA price against the US dollar could dive to the lower trendline and the $0.55 level.
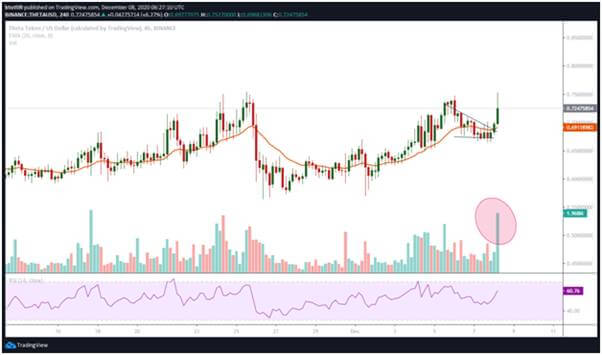 THETA/USD 4-hour chart. Source: TradingView
But despite this negative outlook, the 4-hour chart suggests bulls are likely to counter the sellers. The Relative Strength Index (RSI) is trending north above 60, while a spike in upside volume could contribute to bullish attempts to thwart extended losses.
At the time of writing, Theta’s price was around $0.718. The level is above the $0.70 resistance/support zone but buyers remain capped under the all-time high of $0.80.
If bulls manage to hold onto gains and jump above the September 2020 peak, upward pressure will allow for a bullish momentum towards $0.90 and then $1.00.
The post Theta (THETA) technical indicator highlights a potential nosedive to $0.55 appeared first on Coin Journal.

