Its VOLUME, to know why to read below.
If you have observed one thing trading crypto, it’s that the crypto is highly volatile. Highly with a capital “H”.
Having a 100% jump is nothing abnormal for many Altcoin and 50% or more price fall is the fact after most price pumps.
Behind every price increase or decrease, there is a story. Unlike the traditional market, Crypto is the wild wild west of all trading assets. There is no denying the market are highly manipulated.
A few Whales can create a wave and take all for a ride.
So what can you do about it? Join the whales? Do you have that much money or will they trust you to inform you when and which coin they are planning to pump? How can you trust someone else with your hard earn money?
The solution!
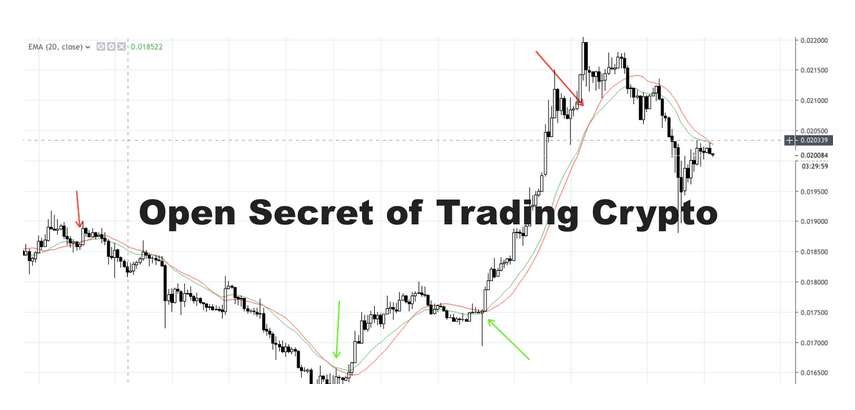
Ignore the noise and focus on the price.
There is a little known fact about tsunamis. Before a tsunami comes and floods the beach and the inland, the beach water level first starts to reside.
If you can be informed when the beach water is residing abnormally that’s your early sign for the coming tsunami.
The reason I compare tsunami with crypto pump is that there is always some sign that all pump indicate. The question is to find those indicators and then tracking those indicators to know when the pump tsunami is coming.
For the first part,
Volume always precedes Price, Always with a capital “A”
Price need the buyers to rise, buyers need sellers to buy from, Seller needs a better price for their asset hence they increase the price, …. story repeats itself till the end of the price pump.
The reason volume is especially high when a pump is about to happen is because the buyer is buying at whatever price the market as to offer. Once all coin from one price is sold the buyer start buying the next price level.
Whats make Volume critical is the rate of volume increase in a lower time frame like 5 Minutes or 30 Minutes candle.
Second part,
Price change, more precisely the rate of change of price is very important to understand.
1% change is 1 Day nothing much,
1% change in 1 Hour might be interesting
1% change in 1 Minute is abnormal
Enough of texts, let me show you some examples
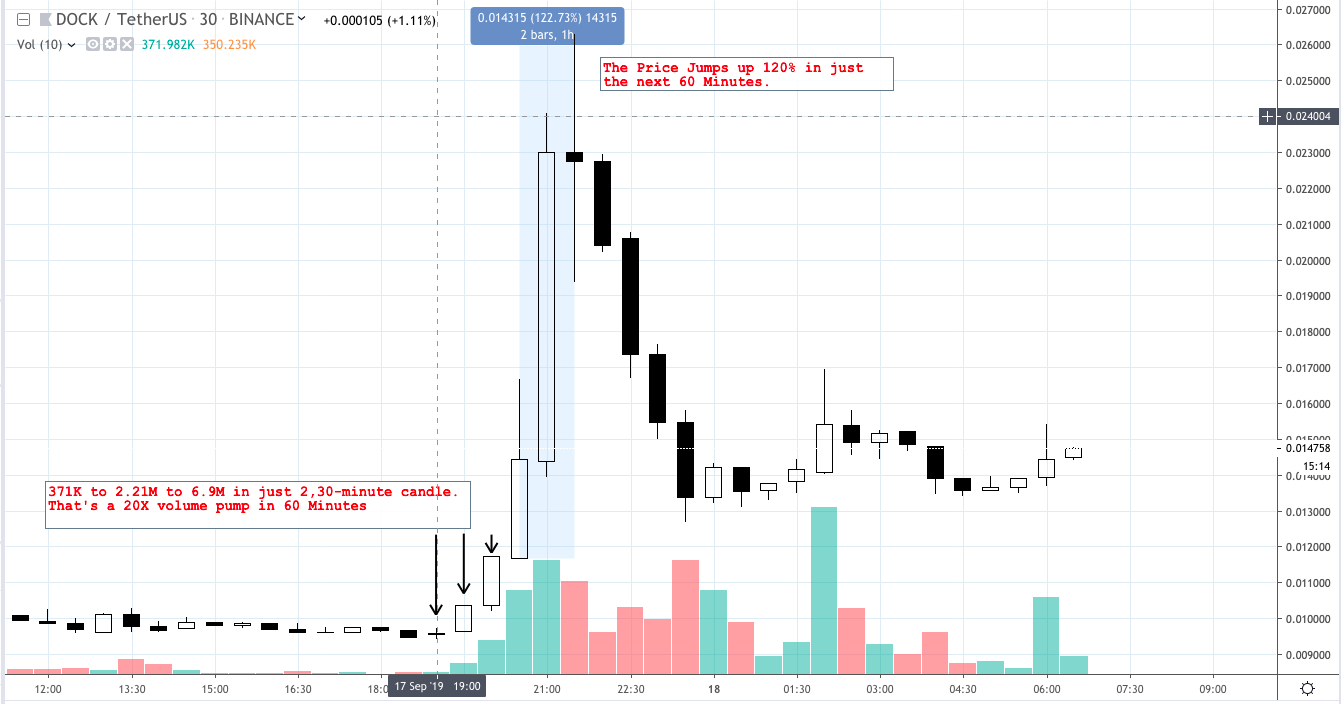
The price increase following the Volume increase.
The above example is DOCK/USDT, where the volume jumps almost 20X in just 2 candles of 30 Minutes. These were a pump created or nature but the volume and price are facts.
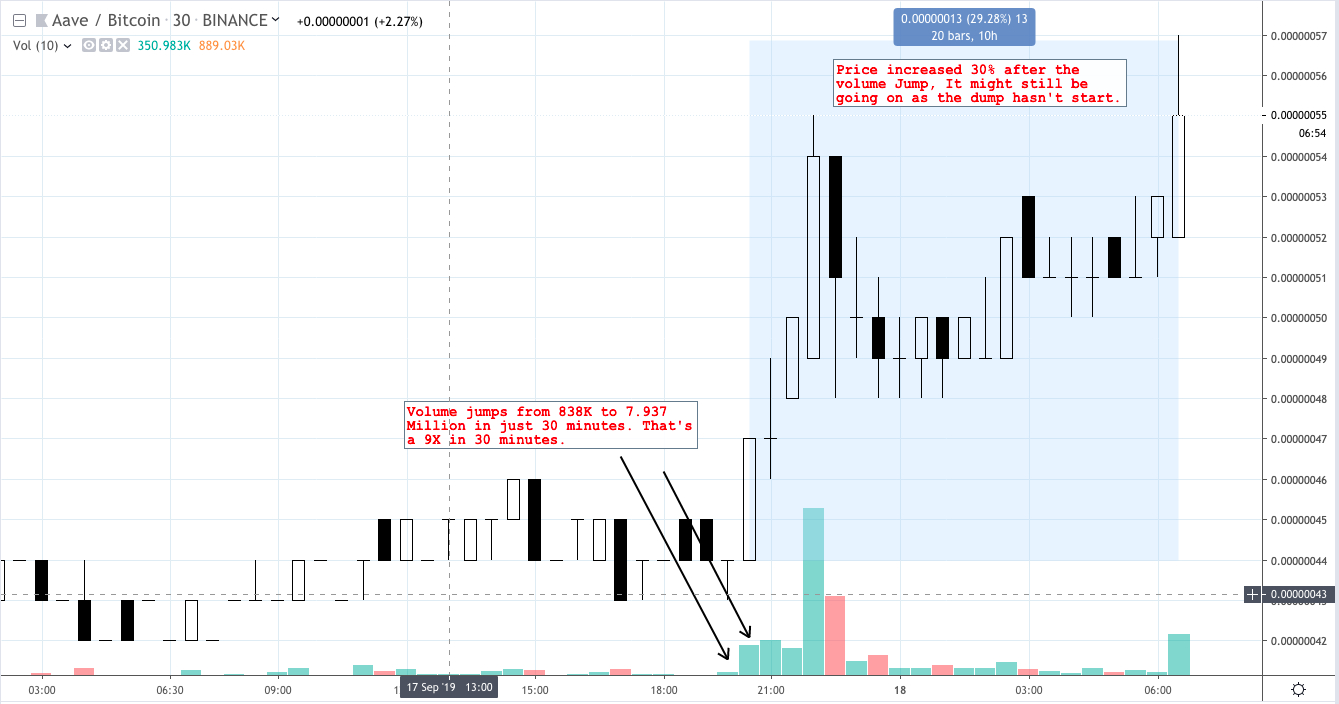
9X Volume followed by 30% Price increases
Another example of LEND/BTC shows the same abnormal volume increase followed by price jump.
You can do it yourself, just go to Binance or any exchange and see the coin with the most price increase. Just go to the 30 Minute and 5 Minute candle chart and you will notice a huge Volume spike before the price started to jump.
The big question is how do I know when this happens, I and you can’t sit and monitor every coin out there every 5 or 30 minutes for 24/7.
This is were a tool that I am building comes into the picture TradePlan.
It’s a simple app that screen and notifies you when something you’re looking in the market or any coin happens to a crypto’s volume jump or MACD crossovers. Have a look and let us know what you think.
One thing I haven’t covered is how to know if the Volume increase is positive or negative. It’s simple if a 10X or so volume cause a price increase that positive and if the Volume cause Red candle that bad. Volume and Price are directly related.

