Bitcoin (BTC) is looking shaky at the start of a new week as $60,000 remains out of reach — could anything change in the coming days?
After an average weekend which failed to deliver the breakout that many had hoped for, Bitcoin is clinging to the mid-$50,000 range.
Cointelegraph takes a look at five factors that can help shape future price performance.
Coinbase IPO a beacon in flat macro sea
Stock markets were unimpressive on Monday, April 5 with many Asian markets closed for public holidays and United States futures seeing little movement.
Following the Suez Canal debacle, oil was the only commodity with noticeable energy as a decision from OPEC+ countries to increase supply put pressure on prices.
With a lack of momentum available, Bitcoin, therefore, had little to sustain any macro-influenced price run, and $60,000 resistance remained in place at the time of writing.
One major event that crypto analysts are eagerly waiting for, however, is Coinbase’s IPO set for April 14.
As Cointelegraph reported, the event is a milestone for the industry but could be accompanied by selling on launch day — a practice seen with other IPOs both old and new.
Elsewhere, U.S. bond yield rises remained a worry this week with their upward trajectory coinciding with a lack of progress for safe havens more widely.
“The repricing of inflation risk and U.S. rates, which will impact discount rates of future earnings and the way stocks are being valued is a source of uncertainty,” Johanna Chua, chief economist for Citigroup Global Markets, told Bloomberg.
“The other uncertainty is the pace of the vaccinations and the virus.”
Analyst: Bitcoin is at the “$3-5K stage” of 2021 bull run
Bitcoin may be struggling for new support, but hodlers need to zoom out for the real picture.
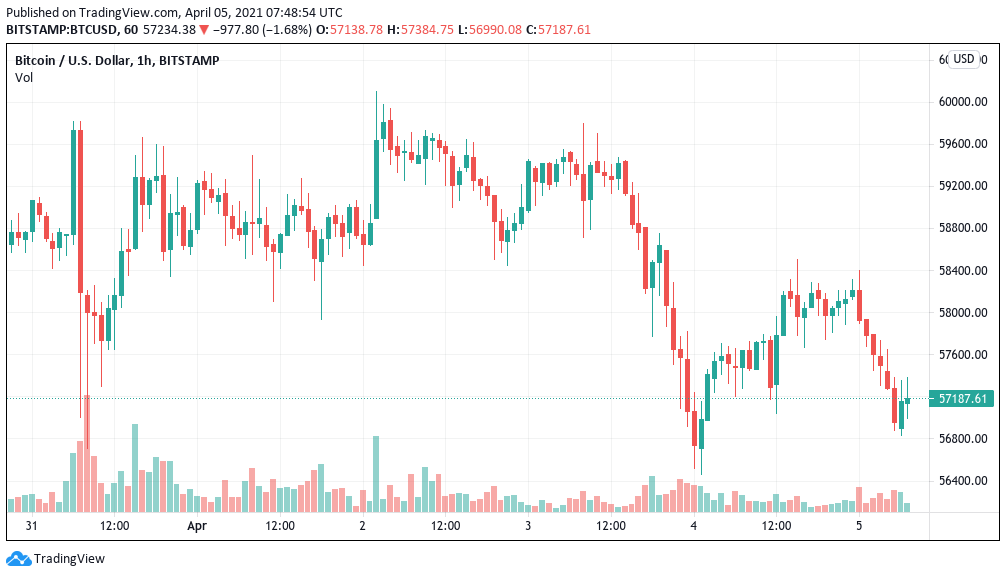
That was the mood among analysts on Monday as BTC/USD headed lower toward $56,000.
After challenging $60,000 yet again late on Friday, the weekend saw bearish moves take over, culminating in a dip to $56,500.
A subsequent rebound was muted, with $57,000 forming a temporary focal point at the time of writing.
“The support resistance battle is intense,” on-chain data service Whalemap added about current behavior on Sunday.
“Levels from last week are working pretty well. Bitcoin is being capped by the $60,045 level pretty spot on. Is this the calm before the storm?”
For popular Twitter analyst William Clemente, however, there was little reason to be bearish on longer timeframes, which have the support of a tranche of positive on-chain data.
“This Bitcoin Bull Run is still far from overheated on multiple on-chain indicators,” he summarized.
“In comparison to 2017, it appears we’re around the $3k-5k range.”
Clemente uploaded a comparative chart showing Bitcoin’s 2013 and 2017 price tops via the Puell Multiple, a classic metric that continues to signal that there is room for growth before a profit-taking sell-off can begin.
Such an early position in the bull cycle implies that the majority of upward price performance is yet to come for Bitcoin, something which would give credence to some of the higher year-end forecasts — $288,000 and more.

No one’s selling
On the topic of miner selling, this is a habit yet to reappear this month.
Despite Bitcoin lingering near all-time highs alongside record network hash rate and mining difficulty, there is no appetite to take profit on mined coins yet, data shows.
Compiled by on-chain monitoring resource Glassnode, the miner net position change has signalled miners retaining their newly-acquired coins over the past week.
By contrast, 2021 has been broadly marked by sell-offs, particularly in January as Bitcoin hit $40,000 for the first time. Sales have come to a halt since, however, regardless of continued — albeit slower — price gains.
“Still not selling, still accumulating, clear trend,” quant analyst Lex Moskovski commented on the Glassnode numbers.

In tandem with miners come exchanges, which continue to see their BTC balances decrease. Traders, then, are no more interested in selling at near $60,000 than anyone else.
Purpose ETF nears 17,000 BTC holdings
Conspicuously bullish this month are institutions — and they are putting their money where their mouth is, the latest figures say.
With open interest in Bitcoin futures markets near all-time highs, institution-grade products continue to see huge demand — albeit if the price is right.
As such, the first licensed Bitcoin exchange-traded fund (ETF) in Canada, the Purpose Bitcoin ETF, keeps adding BTC in step with its assets under management (AUM).
As of April 5, Purpose held 16,462 BTC and $22.1 billion CAD ($17.56 billion USD) in AUM, having only launched its ETF two months ago.

As Cointelegraph reported, the pressure is likely on the U.S. to follow Canada in allowing an ETF onto the market, with such a product set to receive multiples of what Purpose has been able to draw from institutions in its home jurisdiction.
All this, however, could be coming at the expense of a stalwart institutional player, Grayscale, and its Grayscale Bitcoin Trust (GBTC).
In a battle over fees, GBTC may be losing interest to the more economical Purpose, which is one of multiple Bitcoin offerings undercutting the company on its management costs to clients.
Time to channel “situational awareness”
In a classic sign that the mantra of “the longer the perspective, the better” remains best for Bitcoiners, the popular stock-to-flow price forecasting model remains right on track for $288,000 and higher.
As noted by its creator, quant analyst PlanB on Sunday, the model’s “bull/bear recognition signal” is casually repeating its movements from 2013 and 2017.
An accompanying chart showed BTC/USD spot price following its predicted trajectory, with no sign that the model was being invalidated by short-term rumination below $60,000.
The incarnation of stock-to-flow used was stock-to-flow cross-asset (S2FX), an updated version which places Bitcoin within the context of other macro assets and tracks its transformation into a new standard.
“My favorite chart for Situational Awareness,” PlanB wrote in comments.
“S2FX for rough long term level forecast (white line), combined with accurate on-chain bull/bear recognition signal (color overlay).”

S2FX calls for a $288,000 price tag by the end of 2021, this forming an average price in the current halving cycle which will complete in roughly April 2024. The price peak before then, by contrast, could be double the average or $576,000, PlanB has said.


