BTC price could drop to $14,000 before another upside momentum blasts prices past the $20,000 mark
Earlier this week, Bitcoin was on the verge of hitting $20,000. However, instead of testing the all-time high level, BTC nosedived to lows of $16,220.
An attempt to post an immediate rebound hit a wall around $18,900 and will fade further if the rejection continues. At the time of writing, today’s action has seen BTC/USD touch lows of $16,603 although bulls are testing resistance near $17,000.
The likely drivers of the correction include a sell-off by whales when BTC/USD broke above $19,000 and then the massive liquidations witnessed in the futures market over the past three days.
BTC pullback
Although optimistic of BTC/USD at $20K this year, CryptoQuant CEO Ki Young Ju notes that the rally to the historical peak will come after several minor corrections.
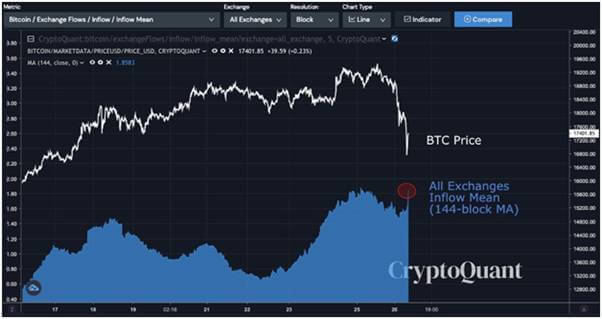
The analyst’s short term outlook for Bitcoin price borrows from the ‘All Exchanges Inflow Mean’ indicator. According to him, the metric indicates selling pressure remains high to mean further corrections or sideways trading.
“More $BTC corrections might come. All Exchanges Inflow Mean (144-block MA) remains still high. In my opinion, we’ll face some corrections/sideways this week and it will break $20k by December this year. I’ll stack some sats a few days after”, Ki noted.
Chart showing Bitcoin’s all exchanges inflow mean. Source: CryptoQuant CEO Ki Young Ju
Another analyst charting the potential correction to $14K is the pseudonymous trader CryptoKea.
According to the trader, Bitcoin’s rally to $19,400 and subsequent rejection is because the price had reached “the top of the bullish channel [which] has done an excellent job in acting as short-term resistance, just as it did at this stage in prior bull markets”.
As can be seen in the chart below, Bitcoin will be in the bullish territory if it crosses the $18,500 level. A drop to the $12,000 area will put it into a bearish zone.
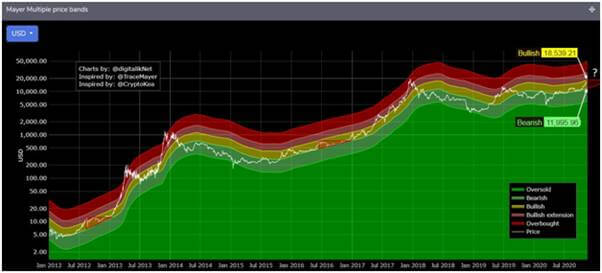 Bitcoin bullish/bearish zone chart. Source: CryptoKea on Twitter
Lookintobitcoin.com creator Philip Swift says the Golden Ratio Multiplier indicator also points to the correction. As per the indicator, a rejection at the 350 DMAx2 curve puts BTC’s main support levels on the downside at $16,000 and $13,000.
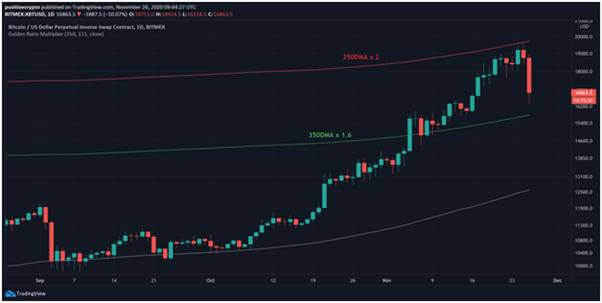 Bitcoin price chart with the Golden Ratio Multiplier indicator. Source: Philip Swift
Entrepreneur and crypto trader Bob Loukas says that trading is “never a way street”.
“Most have a short memory. Remember in Jan 2017 just shy of #Bitcoin ATH’s, boom 34% decline. Then 2 months later a sharp rally, new ATH’s, and double boom 34% decline”.
The sell-off being witnessed in the Bitcoin market is taking place on the back of Coinbase suffering yet another systems outage while OKEx has registered record withdrawals on the resumption of the service.
The post Technical Indicators suggest a 30% correction for BTC appeared first on Coin Journal.

