
The price of Tezos (XTZ) is trading near a key support level, an area that could prove crucial to both bulls and bears short term
XTZ price jumped to a high of $2.27 on November 7 as the asset mirrored enthusiasm across the crypto and global markets. But as the major US media networks called Joe Biden the winner of the US election, Bitcoin fell to lows of $14,567. The abrupt sell-off did not spare altcoins too, with XTZ/USD hitting a low of $1.98.
But the price of Bitcoin is back above $15,000 and XTZ/USD could follow suit unless another superficial recovery ensues to see bears eye damages around $180.
XTZ/USD price analysis
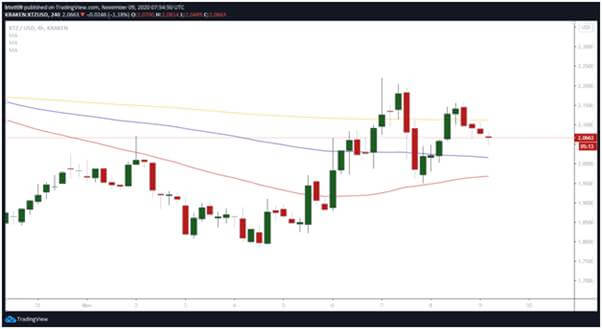
Tezos’ token is changing hands around $2.07 against the US dollar, nearly 2% down in the past 24 hours.
At the moment, sellers appear to have the upper hand as the price has printed four consecutive red candles in the 4-hour chart.
Tezos is below the 200-SMA level on the 4-hour chart and looks likely to trade lower if sell-side pressure mounts in the coming sessions. However, bulls are likely to fend off the bears with the 50-SMA and 100-SMA providing the cushion that the bulls need to absorb the extended selling pressure.
If it bottoms out below the said price levels, the technical picture suggests a dip to support levels around $1.80. This support zone is near the lower curve of the Bollinger Bands squeeze on the daily chart.

The daily chart shows that the XTZ price is below the 50-SMA at $2.11. However, bulls might take note of the likelihood of consolidation above $2.00 if the price remains above the middle curve of the Bollinger Bands.
An influx of fresh buy orders at the level might see the bulls reclaim the 50-SMA support level and aim at taking full control. The upper curve of the Bollinger Bands provides an immediate area of interest once buyers flip the above resistance lines into support.
Looking at the daily chart above, a breakout to the upper boundary of the daily squeeze would clear the path for bulls to test the critical 100-SMA (red line) and 200-SMA (yellow) levels at $2.65 and $2.69 respectively.
If bulls turn these levels into a support zone, XTZ/USD could eye a break above its multi-month resistance line near $3.00. But short term, the key levels to watch are the 50-SMA and 100-SMA on the 4-hour time frame.
The post Technical Analysis: Tezos bulls eye recovery near major support appeared first on Coin Journal.