XLM price dropped from highs of $0.20 to the critical support zone near $0.10 as Ripple (XRP) dumped following SEC’s lawsuit
Stellar (XLM) price is looking to bounce higher after plummeting from highs of $0.20 to lows of $0.109. At the time of writing, the XLM/USD pair is trading around $0.137 and could trade higher if bulls maintain the upside.
However, the technical picture for Stellar (XLM) remains largely bearish in the short term. Just like most digital assets on the top 20 list, the price charts for XLM/USD paint a grim outlook, if prices break below crucial support levels.
The widespread sell-offs in the altcoin market comes on the back of the US Securities and Exchange Commission (SEC) charging Ripple with selling $1.3 billion worth of unregistered securities.
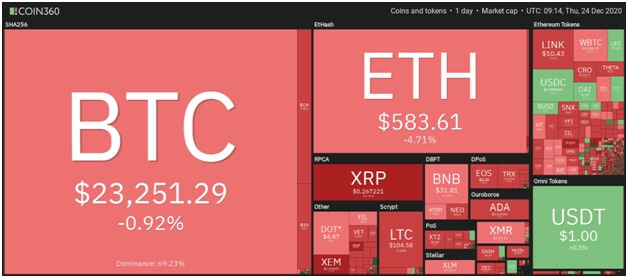
Cryptocurrency market price map. Source: Coin360
XRP/USD has dumped over 56% during the past five days, and over 26% in the past 24 hours. Meanwhile, Bitcoin Cash is down nearly 10% on the day; while Binance Coin (-6%) and Polkadot (-4%) have also posted losses.
ChainLink (-16%), NEM (-16%) and EOS (-22%) are the big losers among the top 20 cryptocurrencies by market cap.
XLM/USD
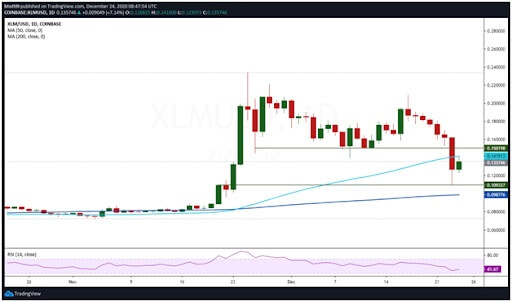
XLM/USD daily chart. Source: TradingView
The stellar price on the daily chart is below the 50-SMA, with a touch base on the 100-SMA offering critical support in the past 24 hours. Currently, bulls are looking to reclaim the upper hand but face massive resistance around the 38.2% Fibonacci retracement level ($0.14) and 50% Fibonacci retracement level ($0.16).
Bulls need to hold off the bears’ assault and push prices above $0.16 to flip the trend. A retest of recent highs near $0.18 could open up the path to $0.20 and then $0.24.
On the downside, a dive below the psychological support zone around $0.10 could clear the path for bears to test the 200-day simple moving average ($0.09).
If the rejection continues past the 200-SMA, an extension of the bearish rally could put XLM/USD on course for $0.06.
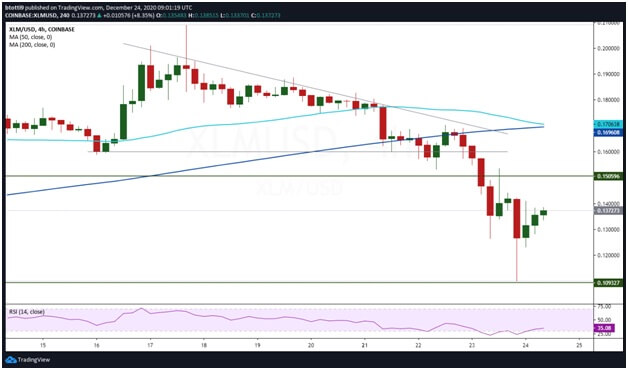
XLM/USD 4-hour chart. Source: TradingView
On the 4-hour chart, the XLM/USD pair is trading up with three successive green candles to suggest a potential retest of key resistance zones. The RSI has turned higher from the oversold territory to indicate increasing bullish strength.
However, Stellar’s price faces huge barriers at $0.15, the 200-SMA ($0.16), and the 50-SMA ($0.17).
The post Stellar (XLM) price plummets amid SEC lawsuit against Ripple appeared first on Coin Journal.

