Key takeaways
- Solana is down 10% in the last 24 hours and is now trading below $140.
- The coin could dip further as the market sentiment weakens.
Market sentiment weakens as cryptos suffer huge losses.
SOL, the sixth-largest cryptocurrency by market cap, has lost 13% of its value this week, making it the third consecutive week of recording losses. The bearish performance comes despite the two-week-old Solana spot Exchange Traded Funds (ETFs) in the US recording the lowest net inflows ever, suggesting softer institutional demand. According to Sosovalue, the US Solana spot ETFs logged $1.49 million net inflow on Thursday, mainly driven by the Bitwise Solana staking ETF. This was the lowest inflow since the inception of Solana ETFs, suggesting a decline in demand from institutional investors.
In addition to that, CoinGlass data reveals that the SOL futures Open Interest (OI) is down 3.34% in the last 24 hours to $7.35 billion. This suggests that futures traders are either closing long positions or reducing leverage.
In line with the current market conditions, the OI-weighted funding rate has shifted to a negative level of -0.0076% from near-neutral levels earlier in the day, indicating that traders are holding more short positions. If the current market conditions persist, the recovery would be a tough battle for bulls.
Will Solana extend the decline to $120?
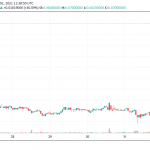
The SOL/USD daily chart remains bearish and efficient as Solana has underperformed in recent days. The coin is edging lower for the fourth consecutive day this week after breaking below the $150 psychological level a few hours ago.
At press time, SOL is trading at $138 and is aiming for the $126 low from June 22. If SOL breaks below this low, it could test the $100 psychological support over the coming days or weeks.

The Relative Strength Index (RSI) dips to 36 on the same chart, oscillating towards the oversold zone, indicating selling pressure. The Moving Average Convergence Divergence (MACD) also failed to cross above the signal line, extending the downward trend.
However, if the technical indicators improve and SOL maintains its value above $126, it could record a slight recovery towards the $155 demand-turned-supply zone. The next resistance level at $175 could prove challenging in the near term.


