
ETH faces sell pressure near $2,070, NEM remains range-bound below $0.43, and XRP is above $1.00.
Ethereum, NEM, and Ripple‘s XRP are all trading in the green on the daily log. However, the ETH/USD and XEM/USD pairs are facing increased sell-off pressure near critical resistance levels. On the other hand, XRP has broken above $1.00 and is looking to strengthen its positive outlook.
Ethereum (ETH)
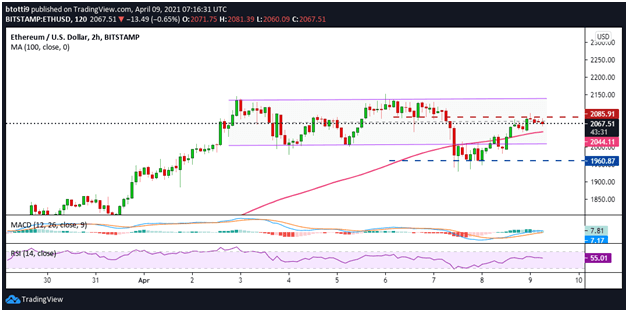
Ethereum fell to lows of $1,930 after recording a $2,152 all-time high, but is currently stuck beneath the $2,085 resistance level.
Bulls are battling downward pressure near the middle of a well-established range on the 2-hour chart.
Despite this, the MACD remains bullish, while the RSI is above 50 to suggest bulls have the advantage. Buyers need to hold above the 100 SMA ($2,044). If ETH/USD bounces higher and clears the $2,085 resistance line, it could reach a new all-time high above $2,200 in the short term.
On the contrary, the key price level to watch is the range low of $2,010, and the horizontal support line at $1,960.
NEM (XEM)
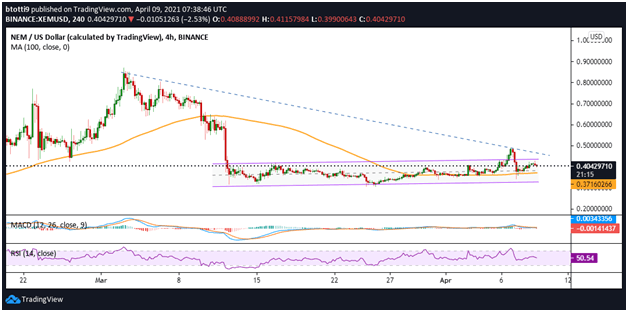
NEM has failed to see any significant price increase since March’s breakdown from $0.86, with the XEM/USD pair range bound between $0.30 and $0.48.
Buyers are trying to push above $0.43 but so far lack the conviction to do so, as suggested by the RSI and MACD indicators. If downward pressure increases, XEM/USD could decline to the 100 SMA ($0.37). Other critical price levels to watch are $0.30 and $0.25.
On the contrary, an upside flip could see buyers target $0.58, with possible short-term goals of reaching $0.72 or even reclaiming $0.86.
Ripple (XRP)
Among the top 50 altcoins on CoinMarketCap, only Enjin Coin (ENJ) with 29% and IOTA (MIOTA) with 15% have recorded bigger gains than XRP’s 10% in the past 24 hours.
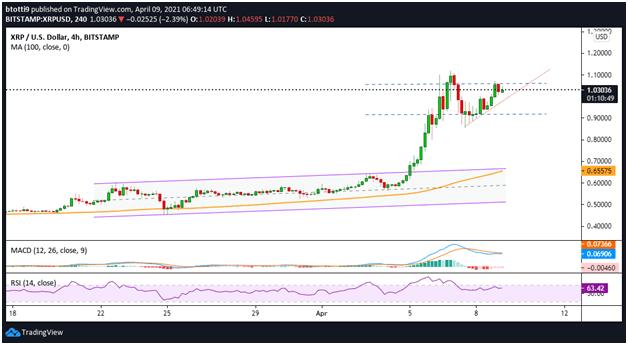
The XRP/USD pair saw a massive increase following a breakout from a parallel channel on 5 April. The coin surged from $0.65 to $1.12 in two days, before hitting resistance and dropping down to lows of $0.85.
A bullish trendline has formed on the 4-hour chart, suggesting bulls may soon retest recent highs. Immediate resistance is at $1.05, with a rally to $1.30 possible further down the line.
$0.91 will be the first line of defence should bears retake control. In the event of strong downward pressure, the price levels to watch would be $0.85 and the 100 SMA ($0.65).
The post Price Analysis: Ethereum (ETH), NEM (XEM), Ripple (XRP) appeared first on Coin Journal.