EOS and Polkadot are seeing minor corrections after recently breaking above resistance levels, while Monero is battling to keep prices above a major support area
Major assets such as Ethereum, Ripple, Litecoin and Cardano are seeing downward pressure after surging to 2020 highs in the past few days.
Similarly, the technical picture for EOS, Polkadot (DOT) and Monero (XMR) suggests bears could wrestle the initiative and push prices lower.
EOS price is down 1.5%, Polkadot is struggling with its value dropping nearly 4% in the past 24 hours and Monero is trying to hold gains above $135 after declining nearly 2%.
EOS
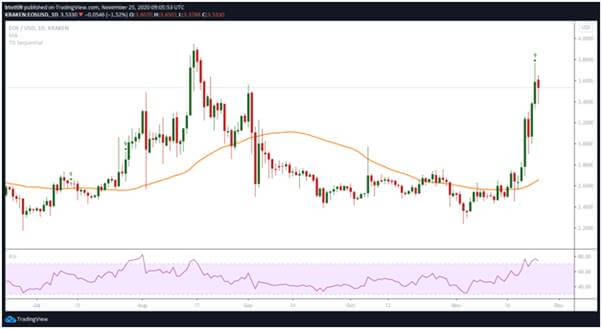
EOS/USD daily chart. Source: TradingView
EOS surged to highs of $3.77 but has struggled to break resistance at this level. The technical picture for EOS/USD suggests a correction is underway.
While the EOS price at the time of writing ($3.53) is 35% up on its value over the past week, a downturn could see it inch further away from its 2020 highs of $5.50.
One indicator suggesting a negative flip for EOS is the TD Sequential metric. As per the indicator, the altcoin has formed a sell signal as shown by the green nine candle on the daily chart.
Validation of the sell signal could see EOS/USD plummet to lows of $3.00. The 50-SMA ($2.65) provides the most robust support.
Polkadot (DOT)
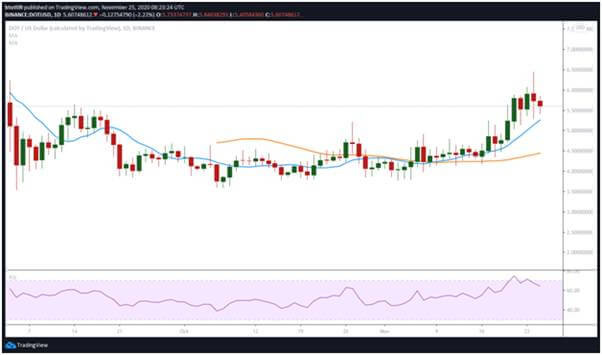 DOT/USD daily price chart. Source: TradingView
Polkadot has turned bearish after hitting resistance near $6.50. As well as the price divergence, the RSI on the daily chart suggests bears are increasingly becoming powerful.
If the negative trend maintains short term, an extended pullback is likely to push DOT/USD to the 23.6% Fibonacci retracement level ($5.15). The next breather would be at the 50% Fibonacci retracement level ($4.87) of the move from $3.71 to $6.00.
DOT/USD could then correct to $4.60 where a massive supply wall would help bulls stage a fight back.
On the upside, $6.00 and $6.50 present hurdles. To keep the momentum though, bulls need a higher close on the daily chart.
Monero (XMR)
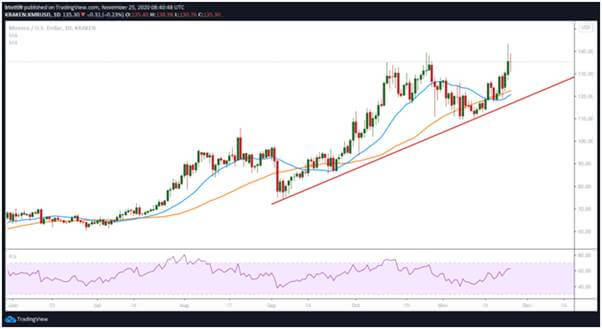 XMR/USD daily price chart. Source: TradingView
Monero remains above an ascending trendline formed since the crash to $73 in September. The XMR/USD pair recently also broke out of a descending channel, with bulls pushing to highs of $143.
The upside is, however, likely to stall as the daily chart features a Doji candlestick. The Fibonacci retracement levels also suggest the uptrend’s weakened momentum could see XMR/USD lodged between the 23.6% and 31.8% Fib levels in the short term. The area is wedged between $136 and $131 on the upswing from $110 to $143.
If selling pressure increases, a decline to the 20-SMA and 50-SMA levels would be legitimate bearish targets.
The post Price Analysis: EOS, Polkadot and Monero appeared first on Coin Journal.

