A bullish breakout above $80 will boost AAVE/USD, with a rally to $100 possible in the next few weeks
Following a rebound over the weekend, the technical picture for AAVE suggests bulls are in control. The short term outlook for the token includes a targeted breakout to $100 should buy pressure send AAVE/USD above $80.
However, bears are likely to still have a say if the broader altcoin market fails to sustain the uptrend. The scenario will likely see AAVE/USD consolidate just above $70 or dip to previous lows near $56, with the worst scenario taking it to $38 near term.
AAVE/USD
As long as bulls hold above $70, the technical outlook for Aave price suggests a rally to highs last seen in August.
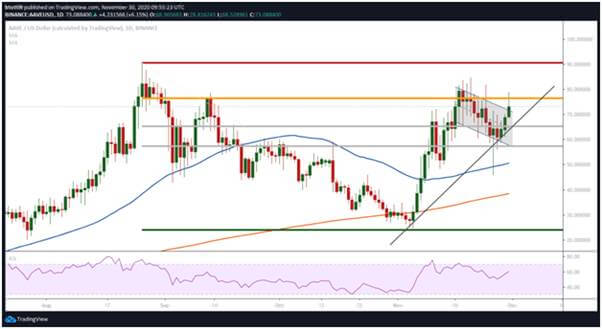
Aave price has broken above the upper boundary of a descending parallel channel. The daily chart shows bulls are currently looking to consolidate above the channel’s upper limit ($71).
If bulls succeed in holding prices above $71, the chart shows that the 0.786 Fibonacci level provides the immediate resistance at $76 (yellow line), with the red line ($90) providing the next major hurdle. Above this level, AAVE bulls would target $100.
AAVE/USD daily chart. Source: TradingView
As shown on the daily chart, the Relative Strength Index (RSI) indicator is trending north to support the short term bullish outlook.
If bulls fail to keep prices above the $70 level, AAVE/USD could retrace to the S/R levels marked by the 0.618 and 0.5 Fibonacci levels ($65 and $57), respectively. The SMA-100 ($55), SMA-50 (51) and SMA-200 ($38) provide further support zones.
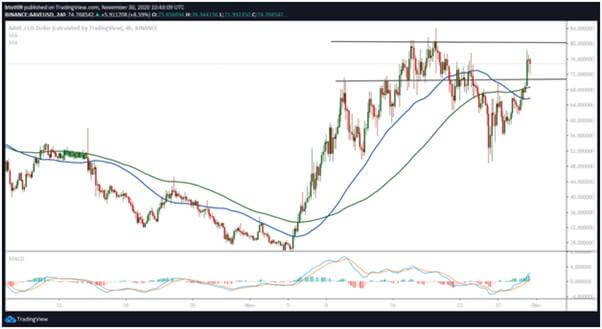 AAVE/USD 4-hour chart. Source: TradingView
On the 4-hour chart, the MACD suggests bulls remain in control, with the formation of a bullish divergence indicating a strengthening of the positive outlook. The RSI is also trending near the overbought region.
However, a slight downsloping in the indicator has coincided with an influx of bearish pressure that has seen Aave price dip from highs above $76 to lows of $71 on the day. This suggests that despite holding the advantage, bulls are not entirely out of the woods yet.
As such, if buyers fail to hold prices above $71 in the next few sessions, AAVE/USD will likely dip to the support level near $68 (100-SMA). Another buffer zone on the downside, as highlighted on the 4-hour chart, is at the 50-SMA ($65).
The post Price Analysis: AAVE bulls target $100 appeared first on Coin Journal.

