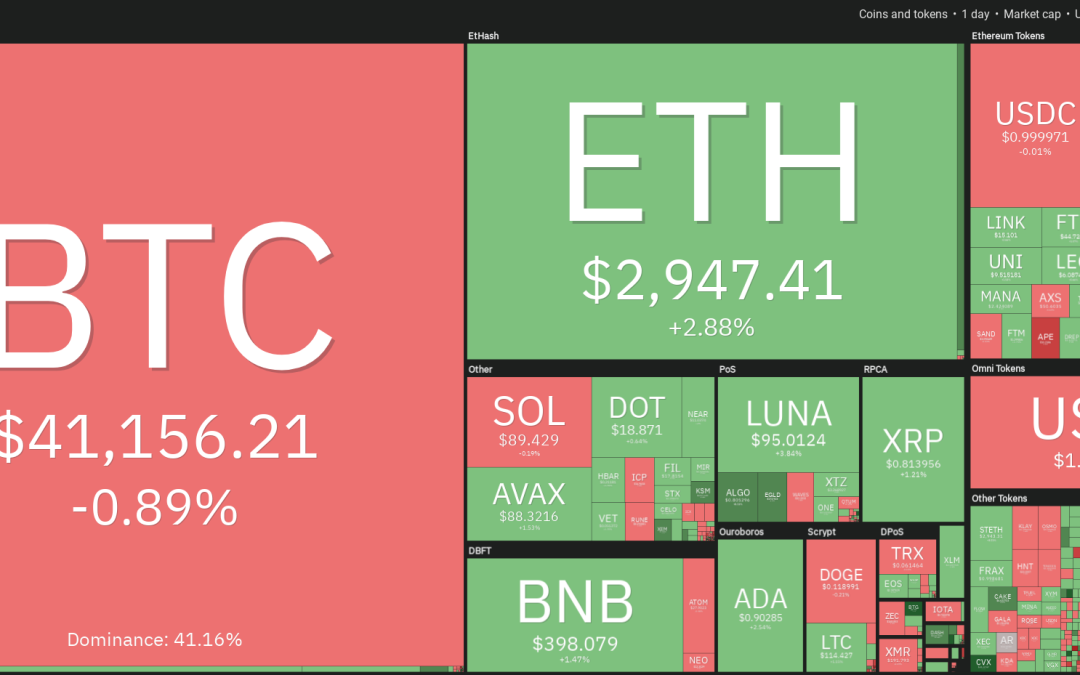
Bitcoin (BTC) and most major altcoins are attempting to start the new week on a positive note by bouncing off their respective support levels.
Goldman Sachs became one of the first major banks in the United States to complete an over-the-counter “cash-settled cryptocurrency options trade” with the trading unit of Michael Novogratz’s Galaxy Digital. This could encourage other major banks to consider offering OTC transactions for cryptocurrencies.
It is not only select nations that are showing growth in crypto adoption. A report by cryptocurrency exchange KuCoin shows that crypto transactions in Africa have soared by about 2,670% in 2022. Bitcoin Senegal founder Nourou believes that Africa could continue its thousand plus percent growth rates in the next few years.
Analyst Willy Woo speculated that Bitcoin’s four-year price cycle, based on the block subsidy halving, may not work as a predictive tool in the future as the price action is likely to be determined by supply and demand.
Could Bitcoin and altcoins climb above their overhead resistance levels? Let’s analyze the charts of the top-10 cryptocurrencies to find out.
BTC/USDT
Bitcoin is facing stiff resistance at $42,594, indicating that bears continue to sell at higher levels. The bears are attempting to pull the price below the moving averages while the bulls are trying to sustain the price above it.

Both moving averages have flattened out and the relative strength index (RSI) is near the midpoint, suggesting a balance between supply and demand. If the price slips below the moving averages, the BTC/USDT pair could drop to $37,000. Such a move will suggest that the pair could spend some more time inside the $42,594 to $37,000 range.
Conversely, if the price rebounds off the moving averages with strength, it will suggest that the sentiment has turned positive and traders are buying on minor dips. That may improve the prospects of a break above $42,594. If the price sustains above this resistance, the pair could rally to the overhead zone between $45,400 and the resistance line of the ascending channel.
ETH/USDT
Ether (ETH) turned down from the overhead resistance at $3,000 on March 19 but the bears could not pull the price below the moving averages on March 20. This suggests that bulls are buying on minor dips.

The bulls will attempt to push the price above $3,000 and challenge the resistance line of the symmetrical triangle. This is an important level to watch out for because a break and close above it will signal a possible change in trend. The ETH/USDT pair could then rally to $3,500.
Alternatively, if the price turns down from $3,000 or the resistance line of the triangle and breaks below the moving averages, it will suggest that the pair may extend its stay inside the triangle for a few more days.
BNB/USDT
Binance Coin (BNB) broke and closed above the 50-day simple moving average ($390) on March 17 but the bulls could not build upon this advantage. The long wick on the March 19 candlestick indicates selling at higher levels.

The BNB/USDT pair turned down and dipped to the 20-day exponential moving average ($386) on March 20. A minor positive is that the bulls have not allowed the price to slip below this level. This indicates that bulls are buying on dips.
If the price rises and breaks above $407, the up-move may continue and the pair could rally to $425. This level may act as a barrier but if crossed, the next stop could be $445.
On the contrary, if the price turns down and breaks below the 20-day EMA, it will suggest a lack of demand at higher levels. The pair could then slide toward $350.
XRP/USDT
XRP bounced off the 20-day EMA ($0.77) on March 18 and reached the downtrend line on March 19. The bears again defended this level but could not pull the price below the 20-day EMA. This suggests strong buying on dips.

Both moving averages have started to turn up and the RSI is in the positive territory, indicating that the path of least resistance is to the upside.
If bulls push and sustain the price above the downtrend line, the buying could pick up further and the XRP/USDT pair may rally to $0.91. If this level is also conquered, the next stop could be the psychological barrier at $1.
The bears will have to pull and sustain the price below the 50-day SMA ($0.75) to gain the upper hand.
LUNA/USDT
Terra’s LUNA token bounced off the 20-day EMA ($86) on March 18, indicating that the sentiment remains positive and traders are buying on dips.

The buyers have pushed the price to the stiff overhead resistance at $96 where the bears are mounting a strong defense.
If bulls overcome this hurdle, the LUNA/USDT pair could retest the all-time high at $105. The bulls will have to push and sustain the price above this level to signal the resumption of the uptrend. The rising 20-day EMA and the RSI in the positive territory indicate advantage to buyers.
Contrary to this assumption, if the price turns down and breaks below the 20-day EMA, several short-term traders may close their position. The pair could then drop to the strong support at $70.
SOL/USDT
Solana (SOL) attempted to break above the downtrend line on March 19 but the bears had other plans. They defended the level and pulled the price down to the 20-day EMA ($87) on March 20.

The buyers have successfully defended the 20-day EMA and will again attempt to push the price above the downtrend line.
If they manage to do that, the descending triangle pattern will be invalidated. The failure of a negative setup is a positive sign as it traps several bears who may have sold in anticipation of a breakdown. The SOL/USDT pair could then attempt a rally to $106 and later to $120.
Conversely, if the price turns down and breaks below the 20-day EMA, it will suggest strong selling at higher levels. The pair could then gradually dip to the support at $81.
ADA/USDT
Cardano (ADA) rose above the 20-day EMA ($0.86) on March 19 and the bulls held off attempts by the bears to pull the price back below the level on March 20. This suggests that the buyers are attempting to start a relief rally.

The bulls will now try to push and sustain the price above the overhead resistance at $1. If they succeed, it will suggest a possible change in trend. The ADA/USDT pair could then rally to the next overhead resistance at $1.26.
Alternatively, if the price turns down from the current level or the overhead resistance and breaks below the 20-day EMA, it will suggest that the pair may remain range-bound between $1 and $0.74 for a few more days.
Related: Bitcoin ‘could easily see $30K’ with stocks due 30% drawdown in 2022 — analyst
AVAX/USDT
Avalanche (AVAX) closed above the descending channel on March 18 and the bulls successfully defended the breakout level on March 20 and 21.

The 20-day EMA ($78) has turned up and the RSI has jumped into the positive territory, indicating advantage to buyers.
If bulls drive and sustain the price above $93, the AVAX/USDT pair could rally to the psychological level at $100. The bears may attempt to stall the rally at this level but if bulls do not give up much ground, the likelihood of a break above it increases.
This bullish view will be negated if the price turns down from the current level and breaks below the moving averages.
DOT/USDT
Polkadot (DOT) broke and closed above the overhead resistance at $19 on March 19 but the bulls could not build upon this advantage. The bears used this opportunity and pulled the price back below $19 on March 20.

A minor positive is that the bulls have not allowed the price to break below the moving averages. The flattish moving averages and the RSI just above the midpoint suggest that the bears may be losing their grip.
If the price rises from the current level, the bulls will attempt to clear the overhead hurdle at $20. If they manage to do that, the DOT/USDT pair could rally to $23 where the bears may again pose a strong challenge.
This positive view will invalidate in the short term if the price breaks and sustains below the 20-day EMA ($18). That could open the doors for a possible drop to $16.
DOGE/USDT
Dogecoin (DOGE) broke and closed above the 20-day EMA ($0.12) on March 19 but the bulls could not sustain the higher levels. The bears pulled the price back below the 20-day EMA on March 20.

The 20-day EMA is flattening out and the RSI is just below the midpoint, indicating that the selling pressure could be reducing. If buyers push and sustain the price above the 20-day EMA, the DOGE/USDT pair could rally to the 50-day SMA ($0.13). The bulls will have to clear this hurdle to open the doors for a possible rally to $0.17.
Alternatively, if the price turns down from the current level and closes below the intraday low formed on March 20, the pair could drop to the strong support at $0.10.
The views and opinions expressed here are solely those of the author and do not necessarily reflect the views of Cointelegraph. Every investment and trading move involves risk. You should conduct your own research when making a decision.
Market data is provided by HitBTC exchange.


