Digital currency markets have seen some gains during the early morning trading sessions on Saturday. Since our last markets update, the entire cryptocurrency economy has gained $4 billion and a slew of the top digital assets are up between 2-6% over the last 24 hours.
Also read: Openbazaar’s New Social Media Platform Aims to Foster Privacy
Top Markets Gain More Than 5% in Minutes
For at least a week, most cryptocurrencies have been consolidating in value and shown very little signs of volatility. On Friday, Jan. 18, prices kicked up a notch as cryptocurrency bulls attempted to break resistance levels throughout most of the day. Finally, during the early morning hours on Saturday, buyers managed to surpass certain resistance levels, which produced gains for most of the top digital assets.

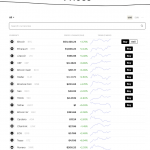
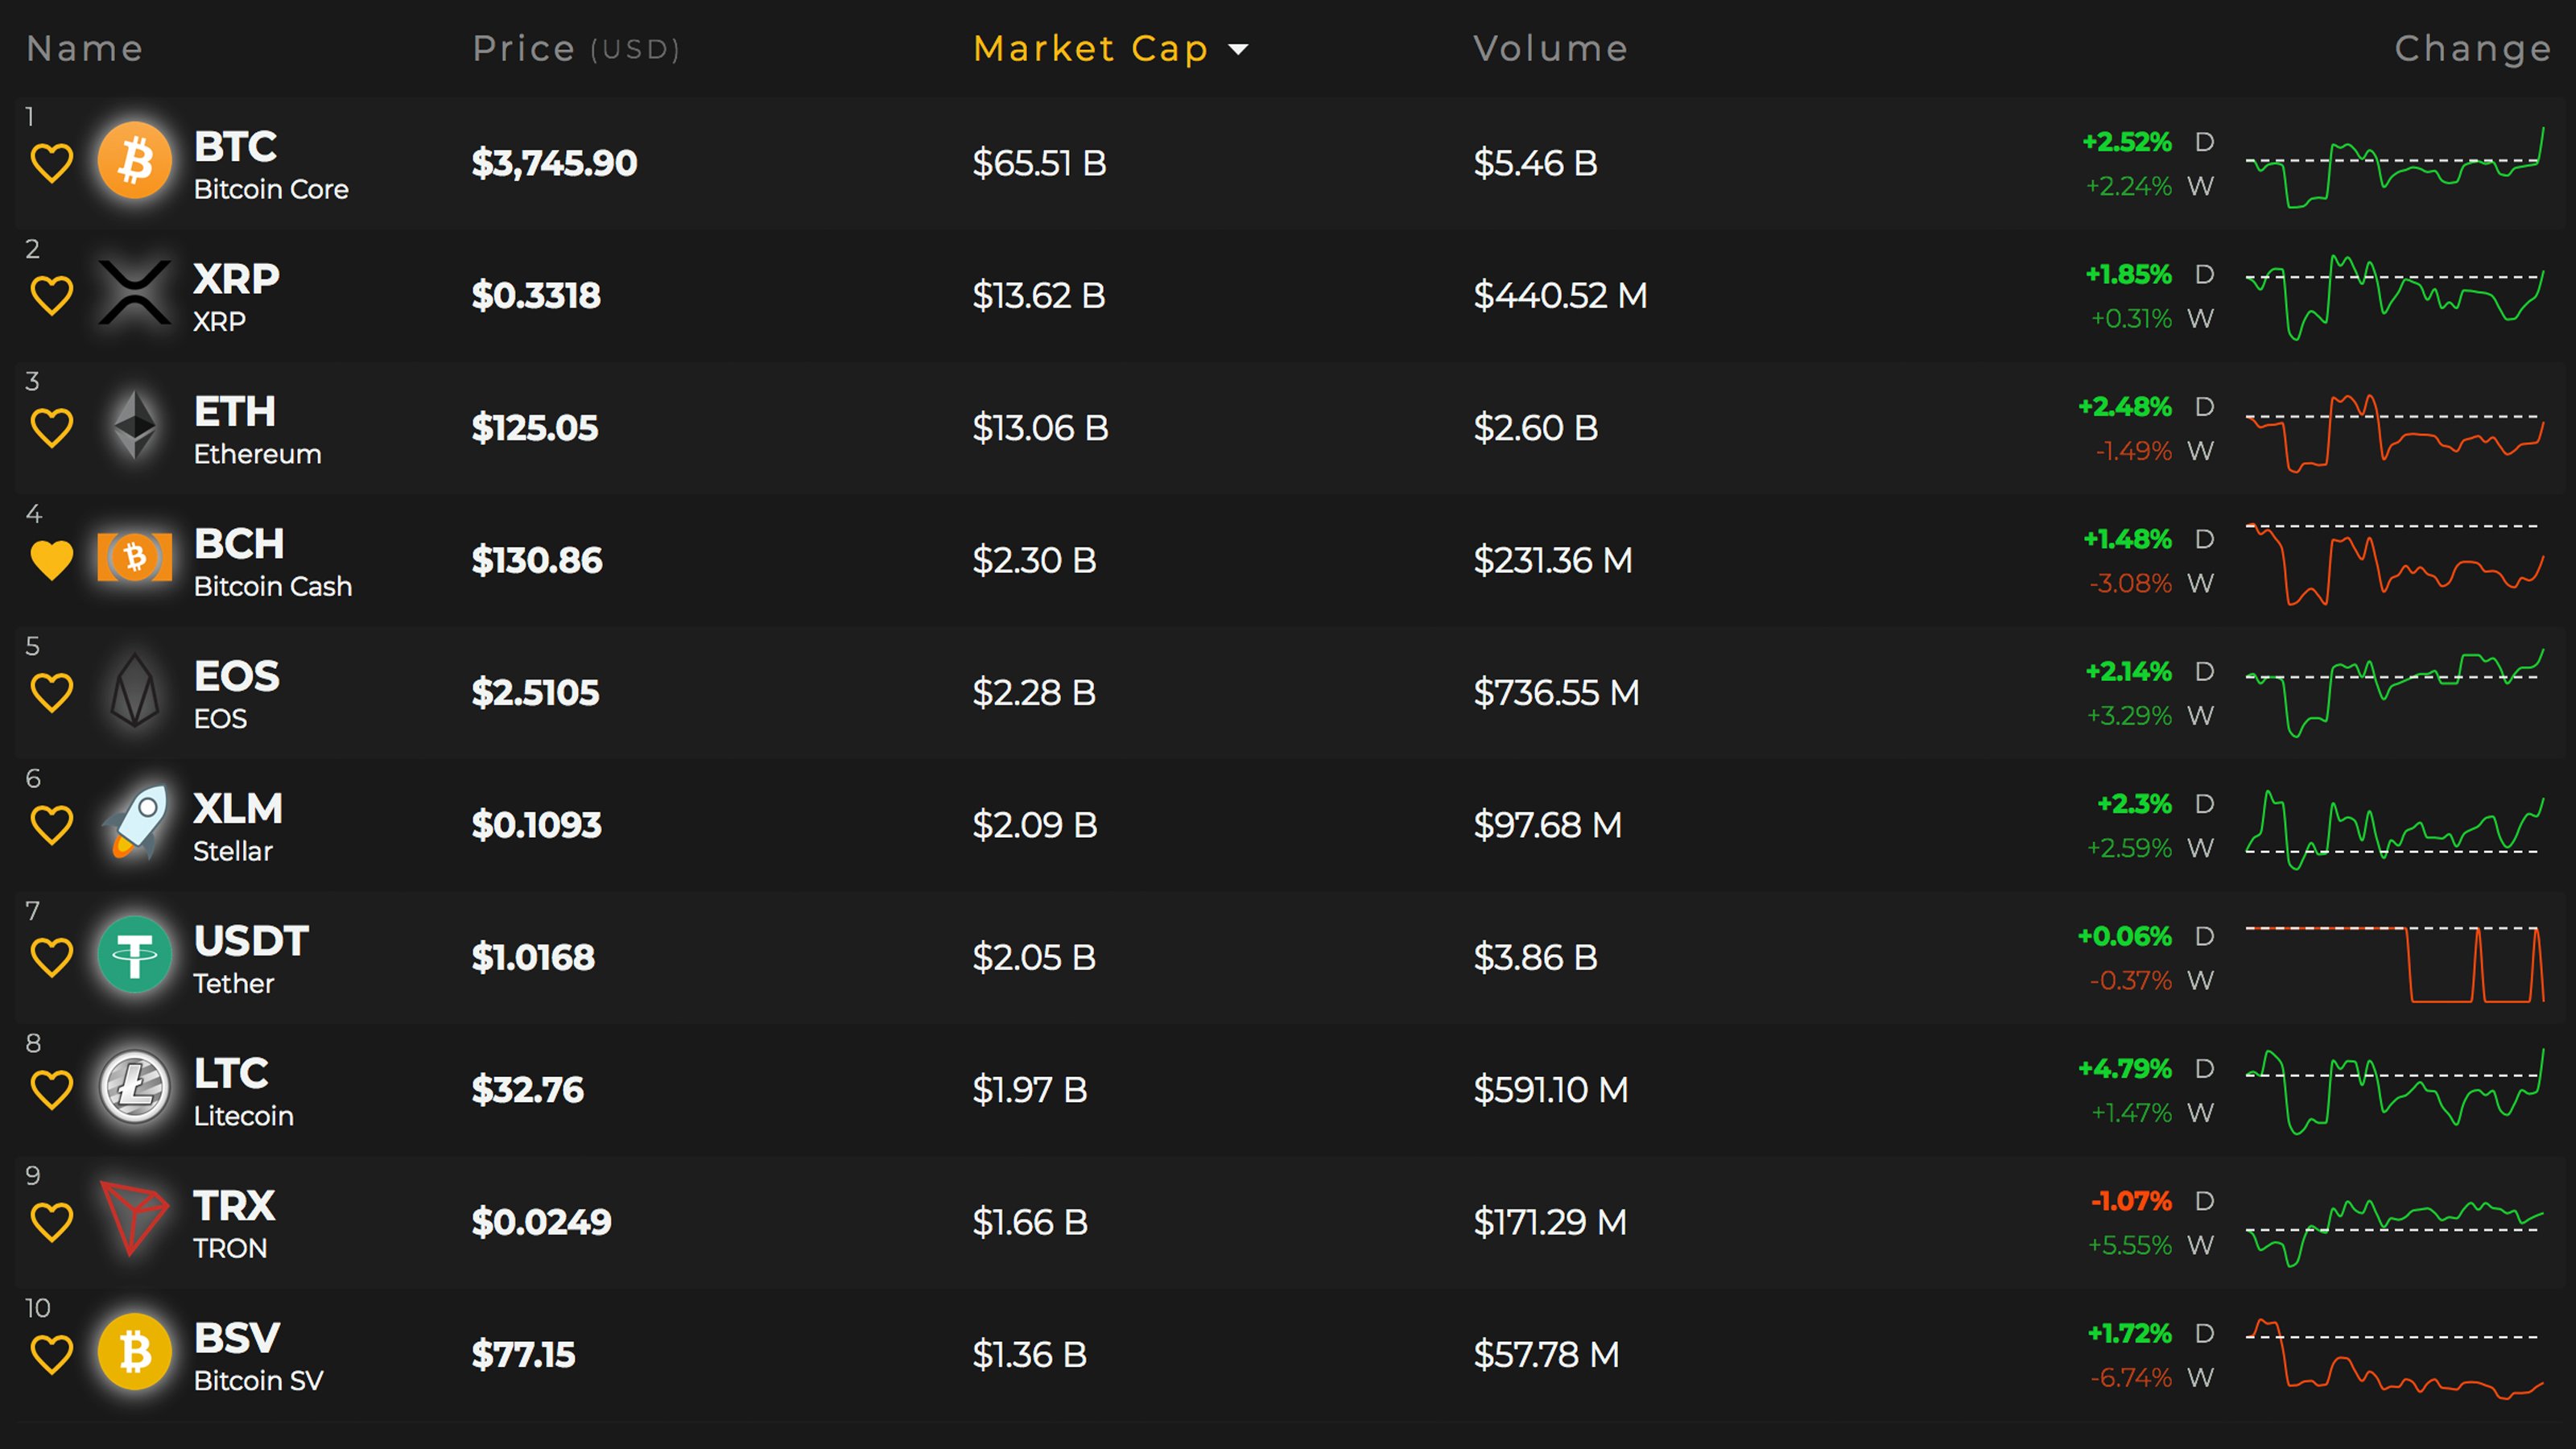
At the moment bitcoin core (BTC) is trading for $3,745 per coin and has an overall market valuation of about $65.5 billion. BTC is up 2.5% for the day and 2.2% over the last seven days. The second largest market cap still belongs to ripple (XRP) and each token is swapping for $0.33 per unit. Ripple markets are up today by 1.8% and are up for the week at 0.31% at the time of publication. Ethereum (ETH) markets still hold the third highest market valuation and ETH is trading for $125 per coin. ETH markets are up today by 2.4% but over the last week prices are down 1.4%. The last coin in the top five is eos (EOS), which is up 2.1% today and 3.2% for the week. EOS is trading for $2.51 per coin and markets have seen $736 million traded in the last 24 hours.
Bitcoin Cash (BCH) Market Action
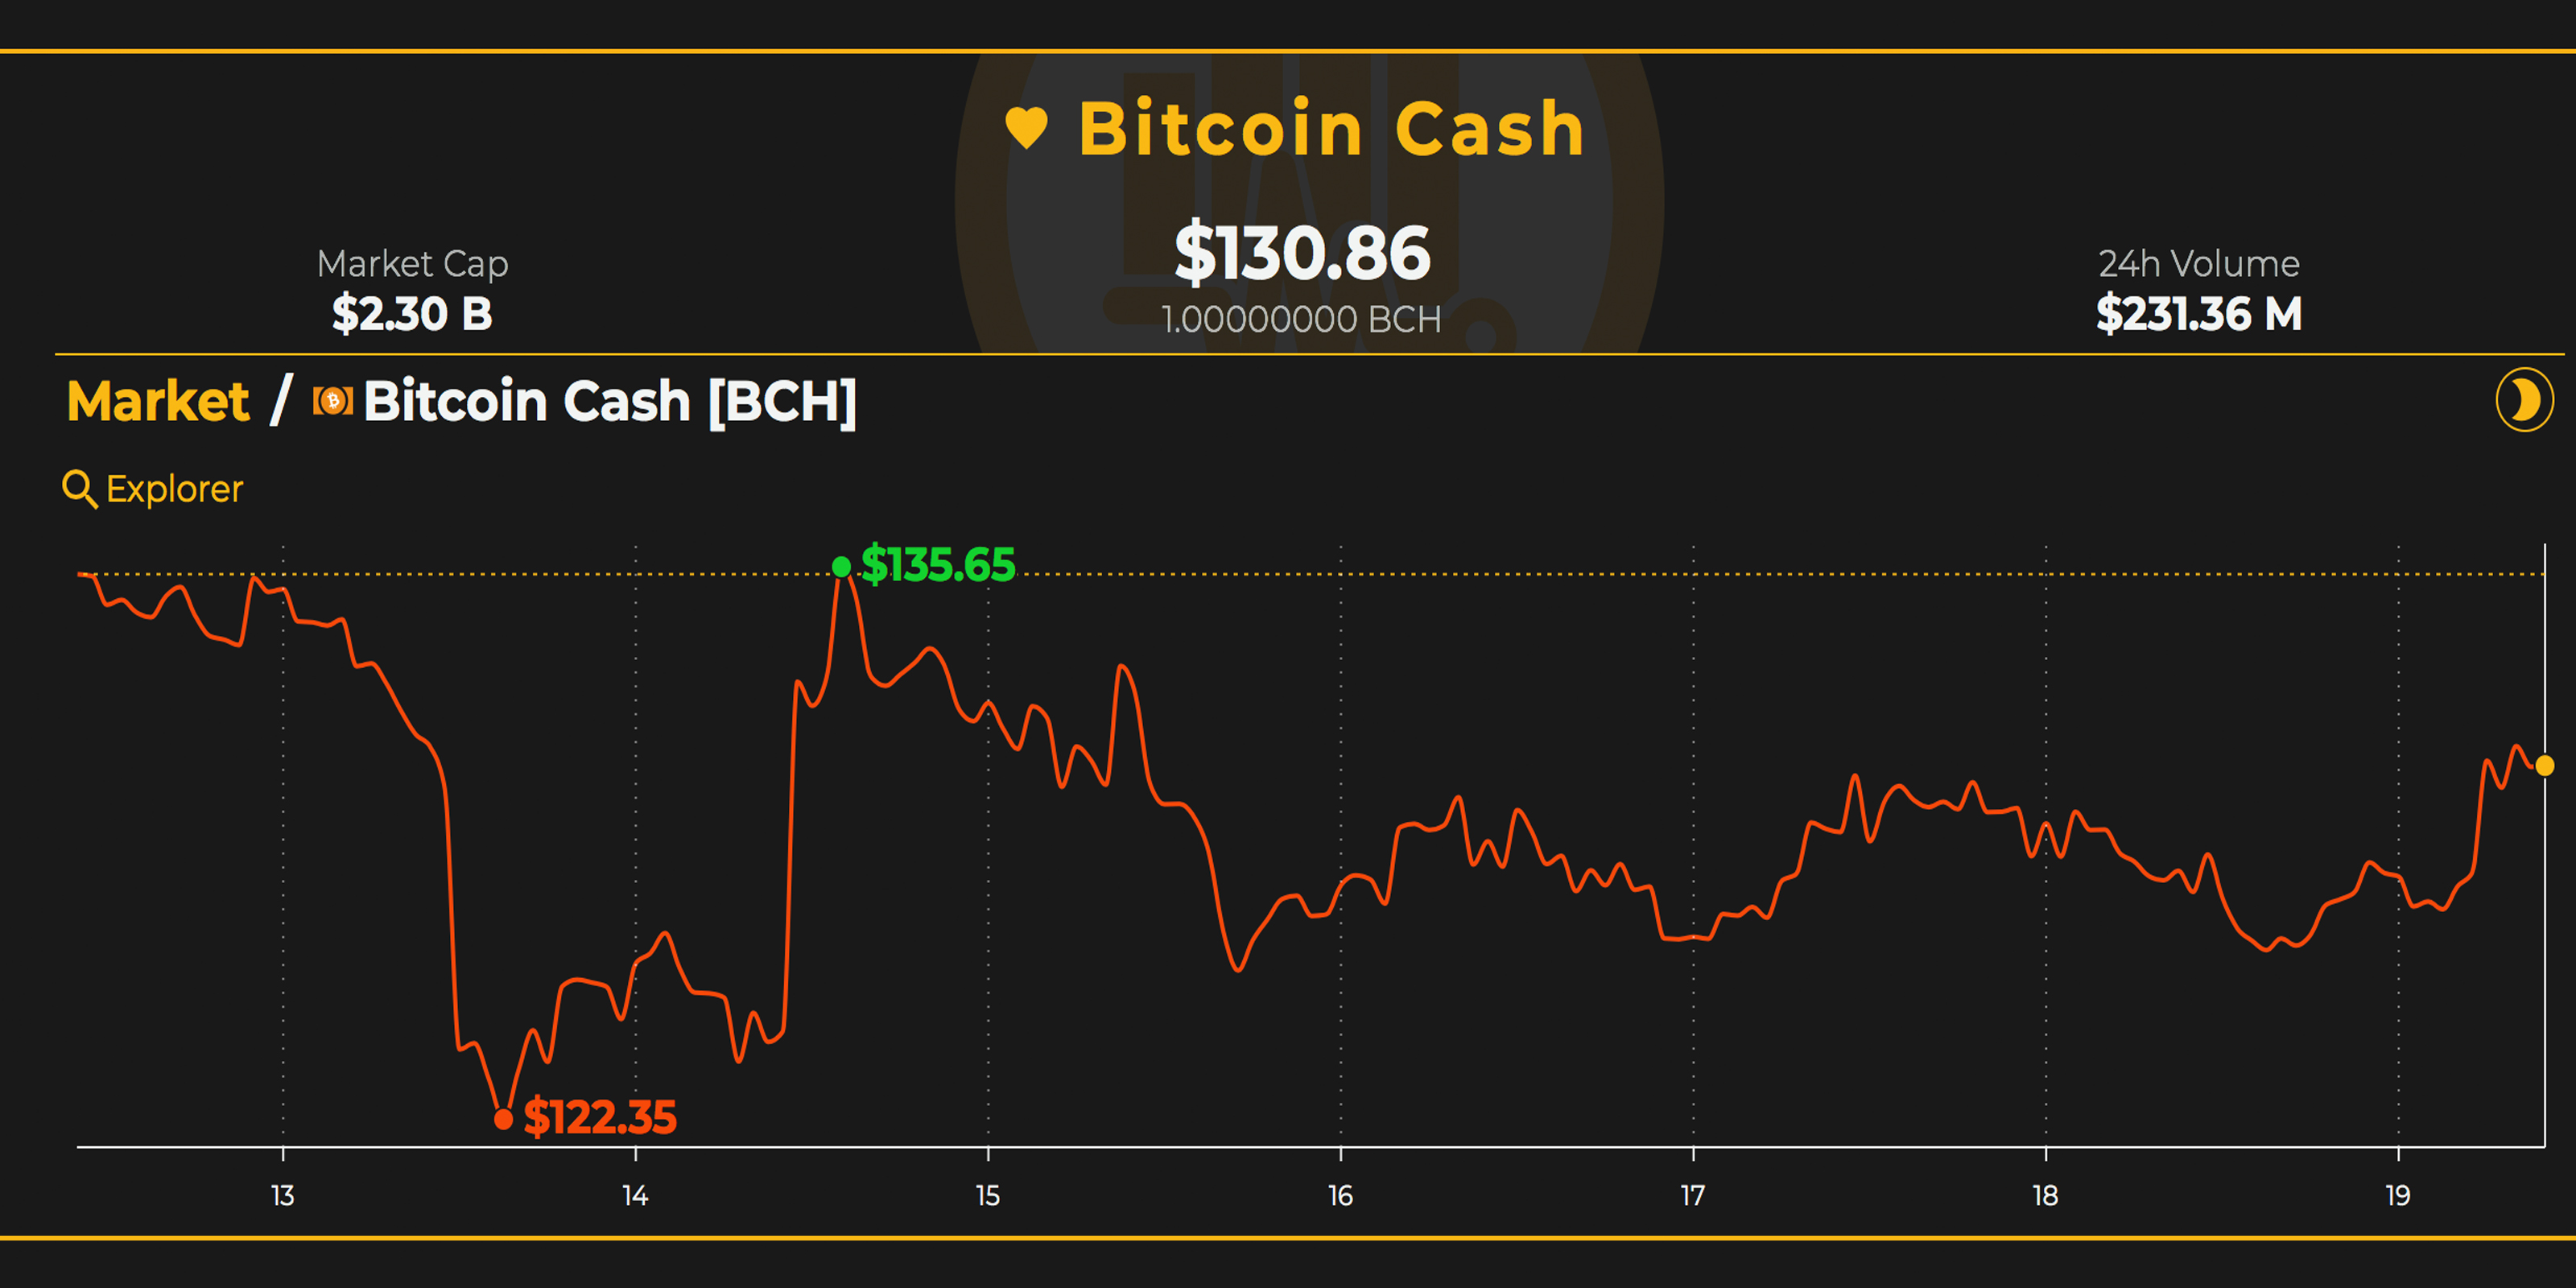
Moving on to bitcoin cash (BCH) markets and BCH is up today by 1.78% with each coin trading for $131. However, markets are down over the course of the week as BCH has seen a loss of 3% for the last seven days. The top five exchanges trading the most bitcoin cash today are Lbank, Hitbtc, Binance, Huobi Pro, and Digifinex. Ethereum is still dominating the currency pairs against BCH this weekend as the coin captures 48% of BCH trades. This is followed by USDT (22.8%), BTC (22.1%), USD (4.3%), and JPY (1.1%). Both the KRW and EUR have dipped this Saturday in regard to the spread of dominating BCH pairs. Bitcoin cash is the ninth most traded cryptocurrency this weekend just below QTUM markets and above the stablecoin GUSD.
BCH/USD Technical Indicators
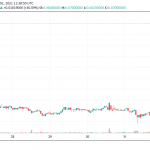
Looking at the four-hour BCH/USD chart on Bitstamp shows BCH bulls have made slight progress during the Saturday morning trading sessions. The two Simple Moving Averages (SMA) still indicate the path toward the least resistance is the downside as the 200 SMA is still above the short term 100 SMA trendline. RSI and Stochastic are coming closer to overbought regions but are still meandering in the middle which indicates some indecisiveness among traders.
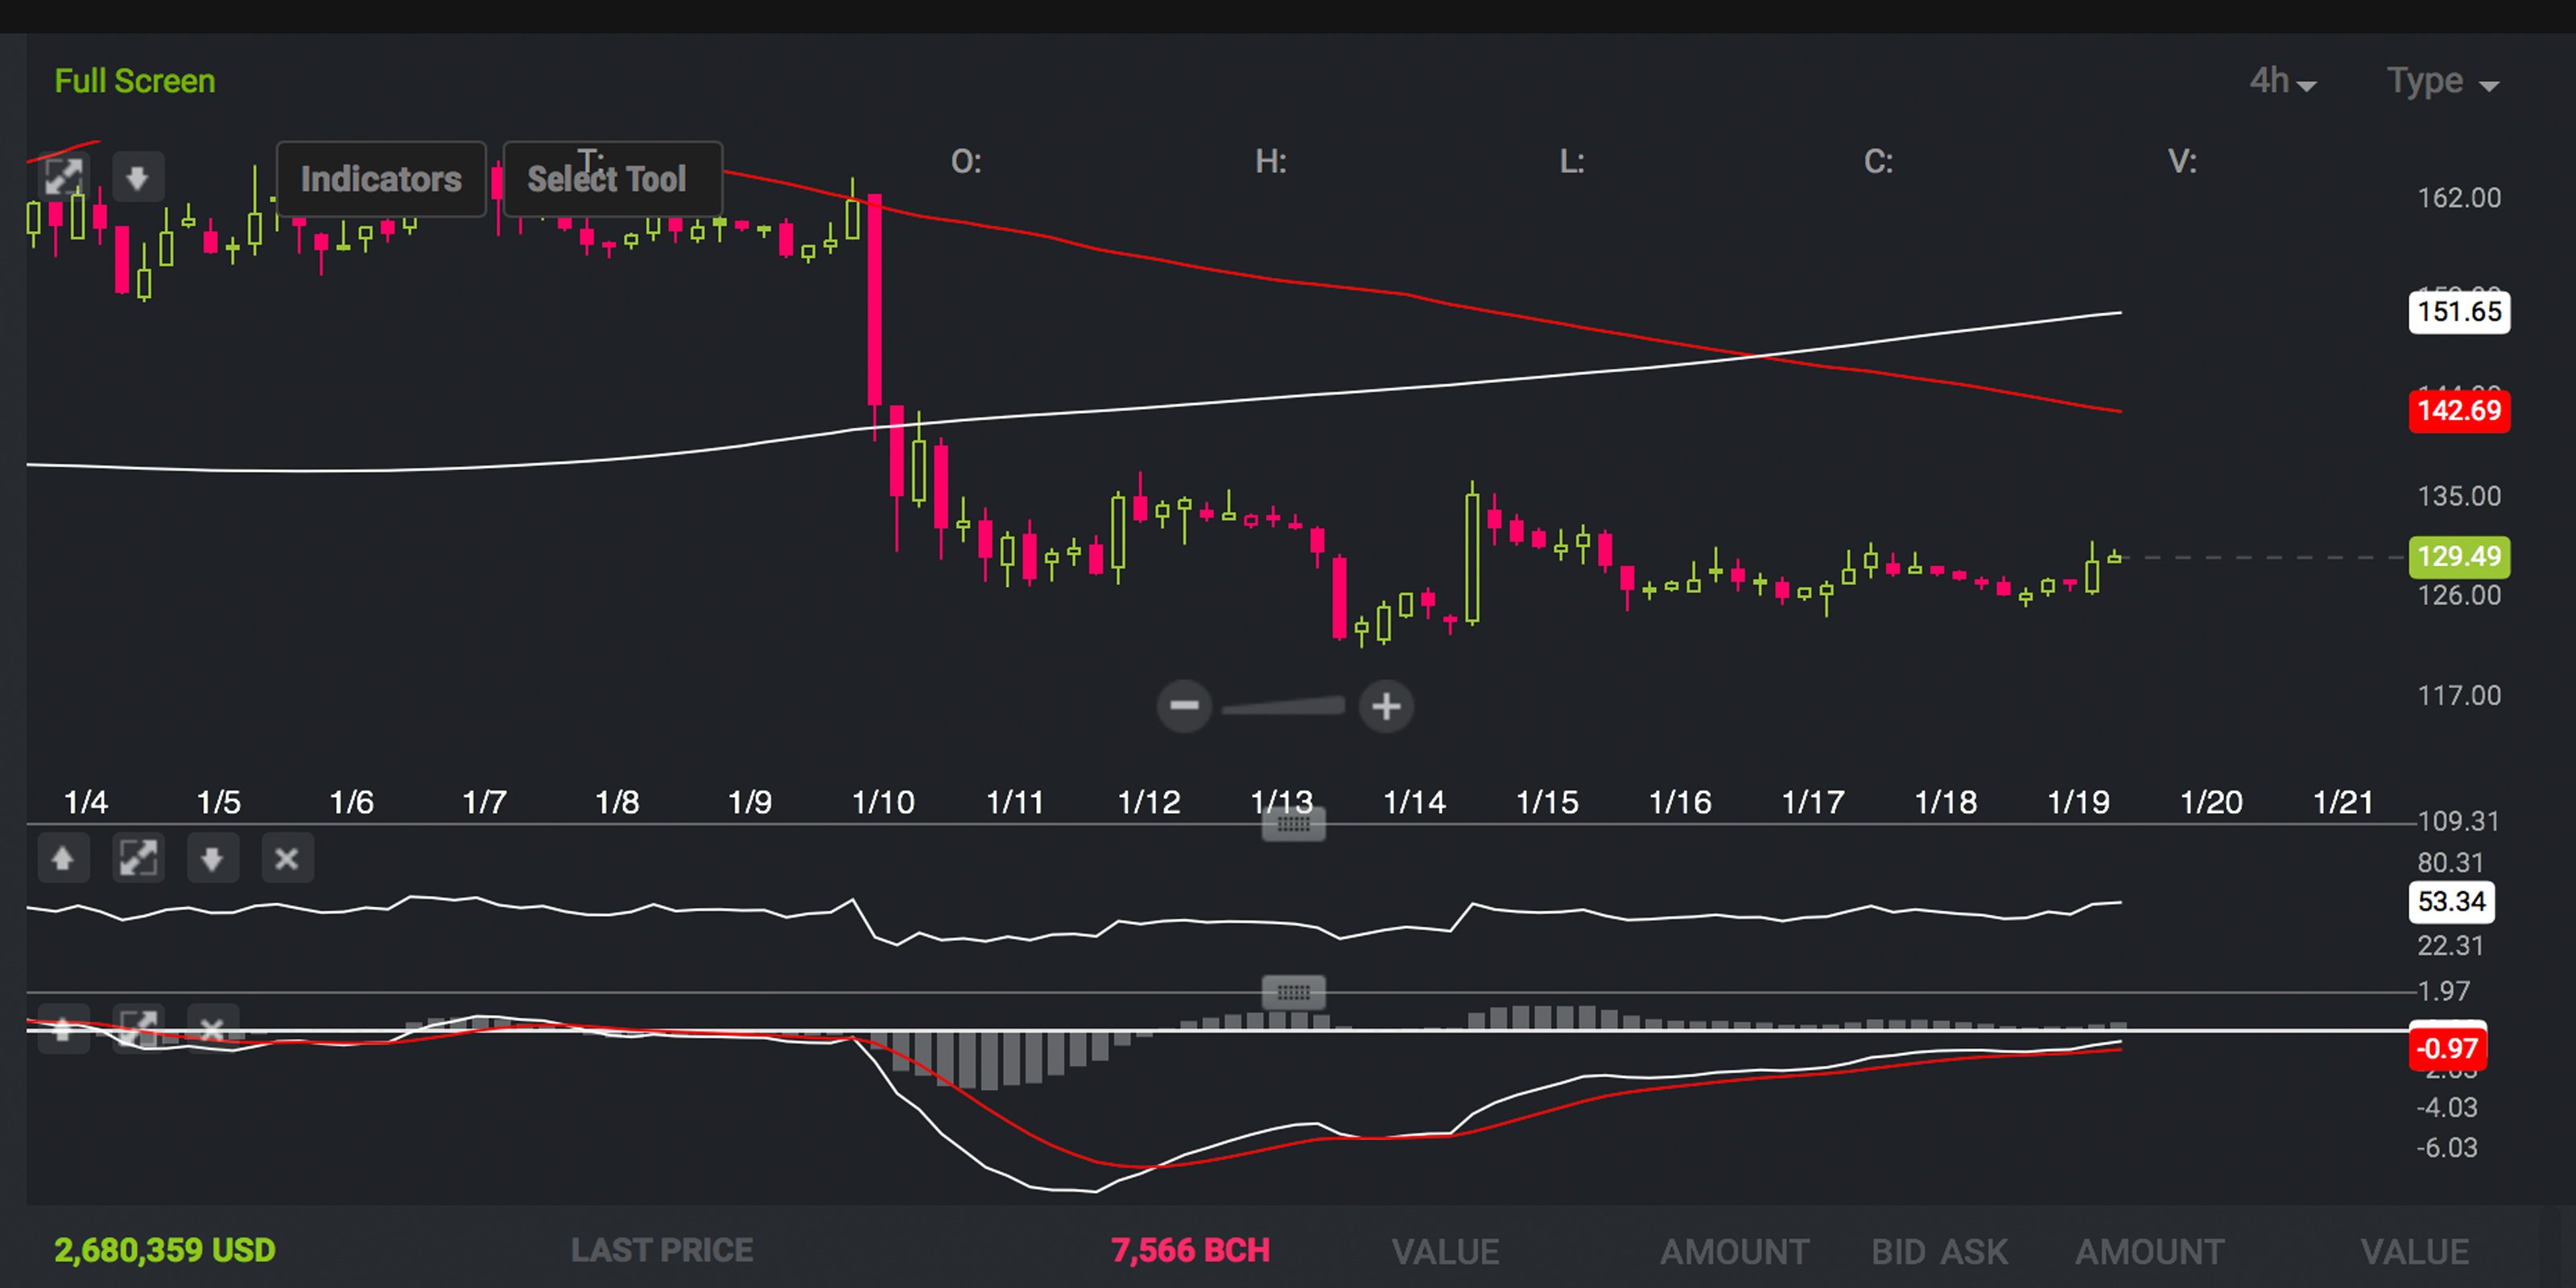
MACd shows in the short term prices could drop again slightly, but it also indicates the duration of today’s movements looks strong. The MACd’s short term trendline is above the long term moving average which suggests short-term momentum will increase. Gradually increasing trade volume also indicates some short term winds have started blowing northbound. Looking at BCH order books, upward movement will be stalled up until the $150 range and there’s some smoother seas beyond that price zone. On the back side there’s some good foundational support up until $115 per BCH but from that vantage point things look much weaker.

The Verdict: Bulls Must Break Further Resistance to Maintain Positive Divergence
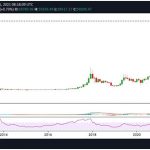
As traders can see, there’s been many signals that show increasing upward momentum but also signs of continued bearish sentiment as well. Some of the reversal signals two weeks ago and now today indicate that buyers have overcame prior selling pressure in the short term. Traders still seem uncertain of how the markets will perform in 2019 and have been playing positions very delicately over the past two weeks. Some of the signs that bulls may continue to push crypto prices northbound is the charts’ previous reaction to lows which can also be identified with the moving averages on the four-hour, daily, and weekly charts. Even though the RSI and Stoch-RSI show there may be a slight correction, positive divergences shown on the four-hour MACd would indicate improving momentum. Range-bound activity shows we may not approach the lows seen back in November and mid-December but there has been signs of buyers showing exhaustion. Bitcoin core (BTC) prices have managed to stay above the $3,500 zone which in turn has kept the rest of the correlated digital assets afloat.
Earlier this week the publisher of the Cryptopatterns newsletter, Jon Pearlstone, said that BTC bulls must stay above the $3,500 range in order to gain upward momentum. Pearlstone has identified a significantly large inverse head and shoulders pattern that has been in the making for three months.
“Since mid-November, bitcoin has built a clearly defined bullish inverse head and shoulders pattern with a target in the $5,000 range,” Pearlstone stated on Jan. 17. “The most recent move back down to retest key support at $, was expected as part of this pattern, and the current consolidation continues to offer an edge for the bulls as long as support holds above $3,500.”
Where do you see the price of BCH, BTC and other coins heading from here? Let us know in the comments below.
Disclaimer: Price articles and markets updates are intended for informational purposes only and should not to be considered as trading advice. Neither Bitcoin.comnor the author is responsible for any losses or gains, as the ultimate decision to conduct a trade is made by the reader. Always remember that only those in possession of the private keys are in control of the “money.”
Images via Shutterstock, Trading View, Coinlib.io, Bitstamp, and Satoshi Pulse.
Want to create your own secure cold storage paper wallet? Check our tools section.
The post Markets Update: Cryptocurrencies Follow Bullish Piercing Pattern as Buyers Advance appeared first on Bitcoin News.

