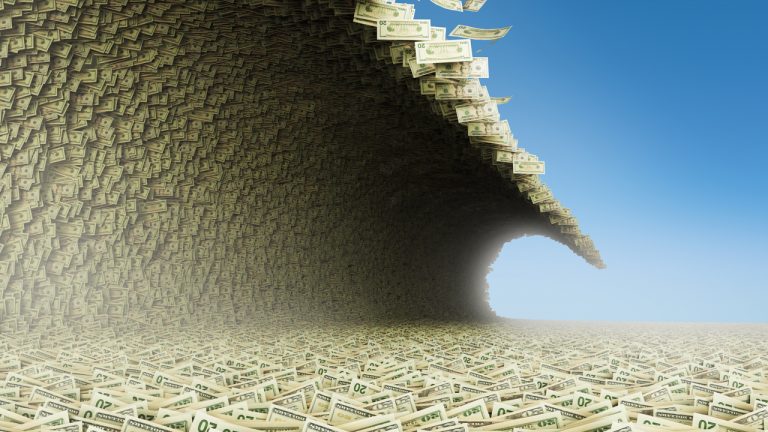
According to a number of reports and commentary from financial analysts, the world is “drowning in U.S. dollars” after the Federal Reserve decided to pump billions of dollars into the hands of 14 central banks via liquidity swaps. Moreover, recent technical analysis shows the dollar’s trade-weighted index chart indicates the USD might be in for a gigantic slide in value in the near future.
As members of the U.S. Federal Reserve plan to convene this week, both gold and bitcoin (BTC) markets have started to climb in value ahead of the meeting. Bitcoin prices rose over 4% during the afternoon’s trading sessions and gold jumped 0.76% as well. The price of one ounce of fine gold is $1,956.24 at the time of publication.

Meanwhile, after a brief upswing in value, the U.S. dollar has started to show signs of weakness again after losing massive amounts of value this year. One financial commentator believes the “world is frozen in response to the deluge of U.S. dollars.”
According to an article written by the business analyst, Stephen Bartholomeusz, “the world has been drowning in U.S. dollars” via “liquidity swaps with 14 central banks.”
“The combination of the access to dollars, the extent of the monetary policy stimulus in the U.S. and the Fed’s recent decision to hold U.S. rates at their current negligible levels – negative in real terms – has seen the U.S. dollar depreciate about 9.3 percent against the basket of its major trading partners’ currencies since March 19,” Bartholomeusz wrote. “That’s its weakest level for more than two years.”
Bartholomeusz added:
A weak dollar exports deflation elsewhere. It helps US exporters be more competitive (albeit while harming importers in an economy with a structural trade deficit) and therefore one that imports more than it exports) while damaging the exports and growth prospects of economies elsewhere.
In addition to Bartholomeusz’s ominous outlook, the U.S. dollar index (DXY) could see a sharper fall in the near future according to a technical analysis report published on Monday. The DXY technical analysis explains that charts show a “bearish, M-shaped chart pattern containing two peaks and a trough.”

If the dollar’s trade-weighted index dips another 5% the pattern will be confirmed the author notes. The pattern is traditionally dubbed the “bearish double-top” and they are typically followed by a strong decline in value.
“The most notorious double-top for the dollar came in 2001-2002, in the aftermath of the September 11, 2001 attacks on the United States, and was followed by a 33% fall in the currency through 2004,” the analysis details. “[The USD] then rallied for about 11 months before continuing its slide to record lows in 2008.”
When the members of the Fed meet on Tuesday and Wednesday, a number of analysts and economists think the meeting will fuel bitcoin and precious metals like gold. The cofounder of Gold Bullion Int. (GBI) and DTAP Capital, Dan Tapiero, championed the two assets after U.S. commercial real estate markets have started to show signs of pending disaster.
“An entire asset class redefined almost overnight by [Covid-19],” Tapiero tweeted. “Total value of all U.S. commercial real estate is $16 trillion. Now entering the largest bear market since the late 80s? 50% price drop wipes out $8 trillion. Major econ drag/knock-on effects [are] huge. Rates stay 0%, + Gold and BTC.”
A recent report published by Pacific Investment Management Co. (Pimco) also explained that the U.S. dollar value drop is just starting and there is “room for the world’s reserve currency to weaken against emerging markets.” Many emerging markets worldwide have advanced the use of crypto assets and decentralized finance (defi) markets.
What do you think about the world drowning in U.S. dollars and the predictions about a major USD decline? Let us know what you think about this subject in the comments section below.
The post Macroeconomic Trends Boost Bitcoin and Gold, US Dollar Index Shows Bearish Double-Top appeared first on Bitcoin News.


