IOTA has reached an intraday high of $0.47, with bulls looking to break above $0.50
IOTA, ranked 41st among the largest cryptocurrencies by market cap, has seen its value surge by about 5% in the past 24 hours to trade at intraday highs of $0.47.
Over the past week, IOTA/USD has climbed 16%, with the last five days seeing the cryptocurrency trade higher along a rising trendline. The charts indicate bulls are likely to push deeper into the green territory and break above the year-to-date high of $0.53 reached on 21 January.
IOTA price reached an all-time high of $5.69 on 19 December 2017 and plummeted to a low of $0.079 on 13 March 2020. Since the Black Thursday crash, IOTA/USD is up 480%. Can it rally higher?
Chrysalis hype could drive IOTA price higher
According to IOTA Foundation, the Tangle-based network is finally set to become enterprise-ready. This will be achieved via increased scaling as the network migrates to a decentralised consensus mechanism via an upgrade dubbed Coordicide.
As a way of preparing the network for a shift from its centralised node called coordinator, IOTA is soon going live with Chrysalis. Also known as IOTA 1.5, Chrysalis is an upgrade implementation that seeks to introduce the changes needed to achieve a secure transition to Coordicide.
Also important to the network is the potential for increased adoption. Recently, the IOTA Foundation signed a strategic agreement to apply the Tangle technology in smart city projects in Europe, South Korea, and Southeast Asia.
If these developments take shape as planned, a production-ready IOTA could be an attractive potential investment.
IOTA price technical outlook
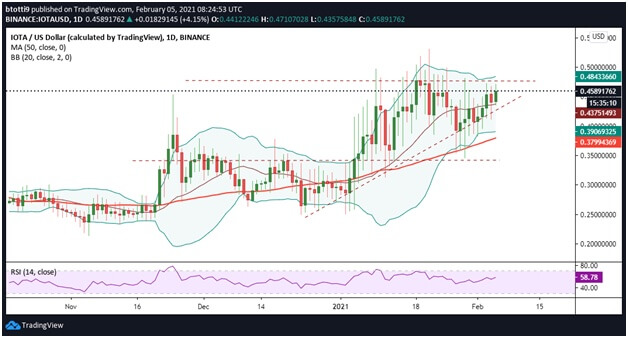
IOTA’s price could see significant gains if buyers rally to break resistance at the $0.48 level. The barrier is just under the upper boundary of the Bollinger Bands. Although the indicator’s curves are wide, a tightening up would suggest near-term volatility.
IOTA/USD daily chart. Source: TradingView
The RSI is pointing upwards to suggest bulls have control. If they keep prices above the middle curve, buy-side pressure will help maintain an upside advantage. In this case, a bullish case can strengthen above $0.53 and target highs last seen in August 2018.
On the contrary, a breakdown below the lower limit of the Bollinger Bands would see sellers target the 50-day simple moving average ($0.37).
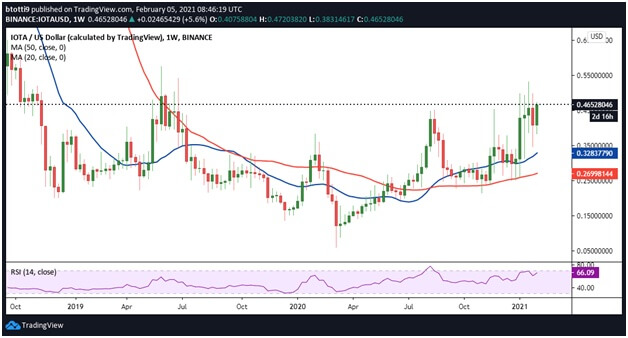
IOTA/USD weekly chart. Source: TradingView
On the weekly chart, IOTA is trading above the 20-day and 50-day simple moving averages. These levels provide strong support zones after acting as major resistance levels for so long. Keeping prices above these levels will be critical to bulls’ plans. Targets above $0.60 include $0.85 and the psychological $1.00 level.
If prices dive to lows of $0.25, it will turn the SMAs into resistance zones and likely plunge IOTA/USD back into sideways trading near $0.15.
The post IOTA price analysis: IOTA/USD turning bullish ahead of Chrysalis migration appeared first on Coin Journal.

