
S&P 500: Short-Term Sell
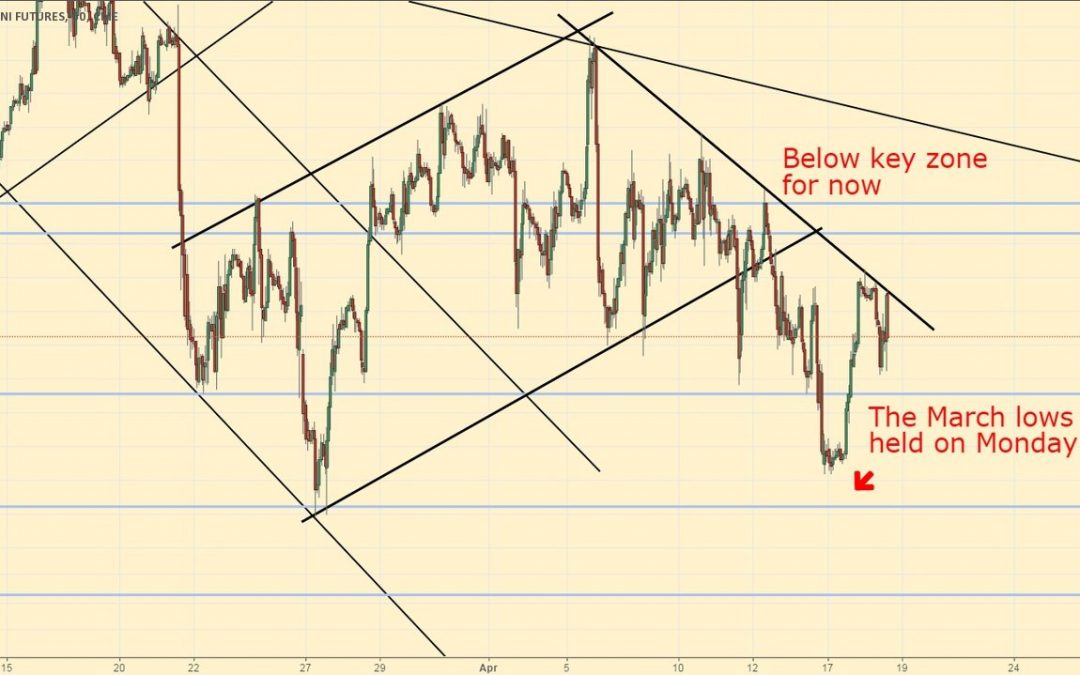
S&P 500 futures, 4-Hour Chart Analysis
The index remains below the line-in-the-sand zone between $2350 and $2355 and the low volume bounce on Monday creates a good short-term opportunity to place a short trade. The prior leader of the global rally, the DAX is still trending lower, and the US indices are likely to follow suit.
The declining short-term trend-line provides resistance near 2345, while primary support stands just below the current price at 2332. A re-test of the 2319 level is likely, while the 2308 level serves as a target for the next possible swing lower. A move above 2350 would likely lead to a re-test of the declining major trend-line.
USD/CAD: Short-Term Buy (update)

USD/CAD, 4-Hour Chart Analysis
The pair respected the long-term uptrend line as we expected, and rallied strongly after hitting the strong support zone around the 1.3250 level. The short-term setup remains bullish, and the move higher justifies a higher stop-loss level near the prior 4-hour swing low.
The declining trend-line resistance near 1.3410-1.3420 is still provides an ideal initial target. Longer-term traders might look for a re-test of the 1.3515 level, with a slightly wider stop-loss level. Primary resistance is still found near 1.3450, while a move below 1.32 would be a very bearish development.
Feedback or Requests?


 steals Dogecoin’s thunder")


