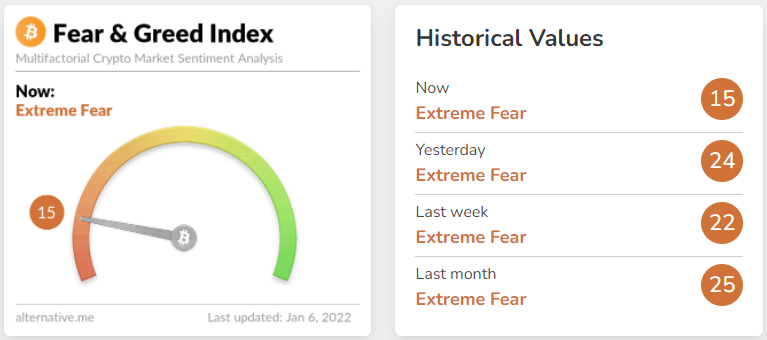
The fallout from the Federal Reserve’s recent hawkish comments about raising interest rates as soon as March continued to weigh heavily on the cryptocurrency market on Jan. 6. The Crypto Fear & Greed index has been dialed down to 15 and some traders are lamenting the possible start of an extended bear market.
Data from Cointelegraph Markets Pro and TradingView shows that bears attempted to challenge the lows set on Jan.5, bringing BTC price down to $42,439 during early trading on Jan. 6.

Let’s take a quick look at where analysts think the price might go in the next few days.
Bitcoin could bottom between $38,000 and $40,000
According to Mike Novogratz, the CEO of Galaxy Digital Holdings and a staunch cryptocurrency advocate, this latest move down “has been on low volume” and highlighted the fact that there is a “tremendous amount of institutional demand on the sidelines.”
As for whether or not Novogratz sees the current market conditions as a good buying opportunity, the experienced trader told CNBC that “he’s waiting a little longer to buy crypto” and suggested that the market will “be volatile over the next few weeks.”
Novogratz said,
“Bitcoin could find a bottom at the $38,000 to $40,000 level.”
BTC attempts to establish a higher low
A closer look at the recent BTC price action was offered by crypto analyst and pseudonymous Twitter user Rekt Capital, who posted the following chart comparing the current market conditions to those that were seen the last time BTC price fell below its 50-day exponential moving average (EMA).

According to Rekt Captial, BTC “has deviated below the blue 50 EMA” and is now in the process of trying to set a new higher low (HL) as represented by the green dashed line.
Rekt Capital said,
“In May 2021, BTC also formed a Higher Low (orange) upon deviating below the 50 EMA. BTC held the HL initially but wicking below it was common also.”
Based on the circled section provided on the above chart, Rekt Capital sees the possibility of BTC dropping down into the $40,000 range.
Related: Bitcoin price bounces off $42K as order book imbalance turns ‘crazy’
BTC price is in the “golden pocket”
A final bit of analysis highlighting the critical junction the market is in was provided by independent market analyst Scott Melker, who posted the following chart showing BTC trading between the 0.65 and 0.618 Fibonacci retracement levels.

According to Melker, this range is known as the “golden pocket” and “is considered the most viable place too long or short an asset and look for a reversal.”
Melker said,
“Price is currently in the golden pocket of the move from $28,600 to $69,000.”
The overall cryptocurrency market cap now stands at $2.077 trillion and Bitcoin’s dominance rate is 39.5%.
The views and opinions expressed here are solely those of the author and do not necessarily reflect the views of Cointelegraph.com. Every investment and trading move involves risk, you should conduct your own research when making a decision.


