
ETH price has traded higher above $1,800 and could target a retest of $2,000 or higher
Ethereum price is above the $1,830 level as bulls target a retest of the resistance at $1,850. The ETH/USD pair is up 8.57% over the past 24 hours, mirroring Bitcoin’s 8.63% upside over the same period.
As Ethereum bulls battle to break resistance around $1,850, BTC/USD is looking to consolidate above $54,000 following yesterday’s move above $51k.
The technical picture for ETH price shows that bulls may have the upper hand short term. In this case, they might retest $2,000 and possibly reach a new all-time peak.
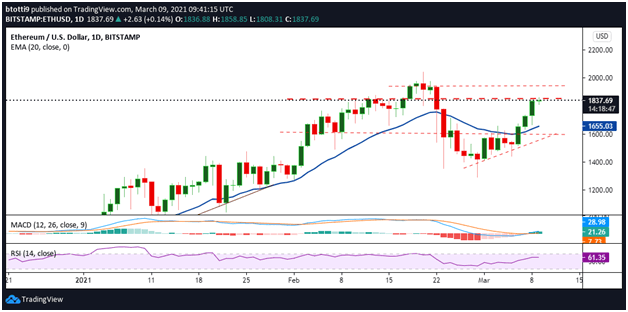
ETH/USD daily chart
- ETH/USD daily chart. Source: TradingView
On the daily chart, ETH/USD is looking to register a fourth consecutive green candle. The price is also nicely primed near a horizontal resistance line at $1,855.
The daily RSI indicator is suggesting a positive divergence, with the signal at 61 to give bulls a slight advantage. The MACD is also within the bullish zone, with the green bars of the histogram suggesting a potential strengthening of bullish momentum.
If the bulls manage to break above $1,850, the next barrier could be at $1,900, with bulls probably rallying to the major supply wall near $1,938. A breakout above this line on sustained upside momentum could push ETH/USD past the all-time high of $2,040.
Contrary to this, bulls will need to defend gains at the $1,800 level. There is no major support level until the 20-day EMA ($1,655), with further anchors at $1,582 and $1,291.
ETH/USD hourly chart
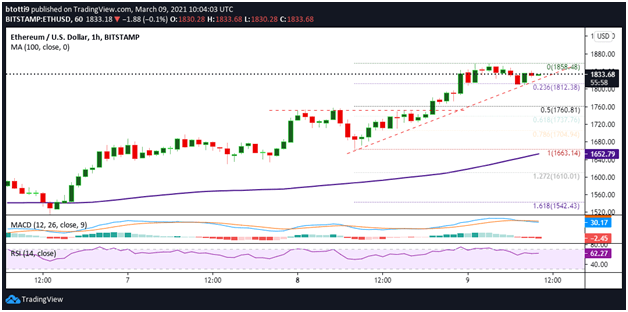
- ETH/USD hourly chart. Source: TradingView
On the hourly chart, Ethereum remains perched above the $1,800 level despite a slight downturn towards a bullish trend line. While bulls still hold the upper hand with the RSI above 60, the MACD suggests some a slowing down that could see ETH/USD dip below the aforementioned trend line.
If that happens, the initial support level is at $1,812, the 0.236 Fibonacci retracement level of the swing from $1,663 to $1,858. Any more losses could force bulls to retreat to the 0.5 Fibonacci retracement level ($1,760) and then the 100-hourly simple moving average.
The SMA 100 ($1,652) offers a robust support zone, but prices could still breach this wall and reach lows of $1,542 (1.618 Fib level on the hourly chart).
On the flip side, breaking above resistance at $1,850 will allow bulls to target $1,900, with further gains seeing bulls attack the $2,000 level. From here, buyers can bank on increased demand to send prices to a new all-time high.
The post Ethereum price: ETH signals fresh upside momentum above $1,800 appeared first on Coin Journal.