Ethereum continues to delight traders everywhere. It has rallied from $15 to $30 per coin in just a matter of a couple days. Regular readers knew to be watching this market, so I hope that all here have added appreciably to their trading accounts.
It goes without saying that all good things come to an end, so the question once again arises: “Where is the top?”
Of course, the charts are rarely kind of enough to tell us the answers to this question with 100% confidence. But the charts do give us indications of where pricetime wants to go, and sometimes that is enough information for our needs.
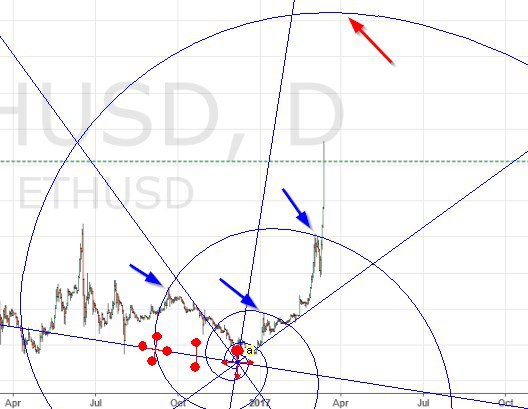
Let’s start with a look at the vortex for its guidance:
The blue arrows demonstrate that the vortex correctly forecasted the last 2 major resistance points. The red arrow is all the way up to $45, which is suggesting that this rally still has a lot more room to go.
However, my Gann setup is a bit less sanguine:
 Here we see that the pullback at $30 was at the 4th arc pair, and was also at the “1 line” of a long-term Pitchfork (brown line). The 5th arc and top of the 5th square are at ~ $36 and $39 respectively.
This also argues that the rally is not over yet, although the “1 line” of a pitchfork is normally quite resilient as S/R. Certainly, a convincing break above the “1 line” and the 4th arc will signal another buying signal.
Bitcoin
Bitcoin has taken a rest during the past few days, as its lesser known siblings such as ETH and Dash have taken center stage. At some point in the not-distant future, it will likely make new ATH, but I see little reason to trade that market while the other altcoins are on fire.
Happy trading!
Remember: The author is a trader who is subject to all manner of error in judgement. Do your own research, and be prepared to take full responsibility for your own trades.
Featured image from Ethereum.


