Ethereum
Ethereum continues to exceed expectations. As these words are being written, Ethereum’s daily chart is sitting at the All Time High set last June. It seems highly likely to break that ATH soon. Having said that, it should come as no surprise when/if at some point shortly thereafter it comes back down to test support at that point. But assuming that support holds, this trade will likely get rather fun.
Regular readers will know I have been suggesting to readers for the past week or two that ETH is the trade to watch (see here and here) , and that has certainly been proven to be the case so far. I realize that many traders do not accept the possibility that geometry and other esoterica can be useful as a trading system. But regardless, it is still interesting to look at today’s markets through the lens of the work of some of the greats of the past. I typically use the Gann square (as developed by Eduardo Altmann) to model support and resistance. But in today’s column I will use a variety of other geometric tools to look at where price might go.
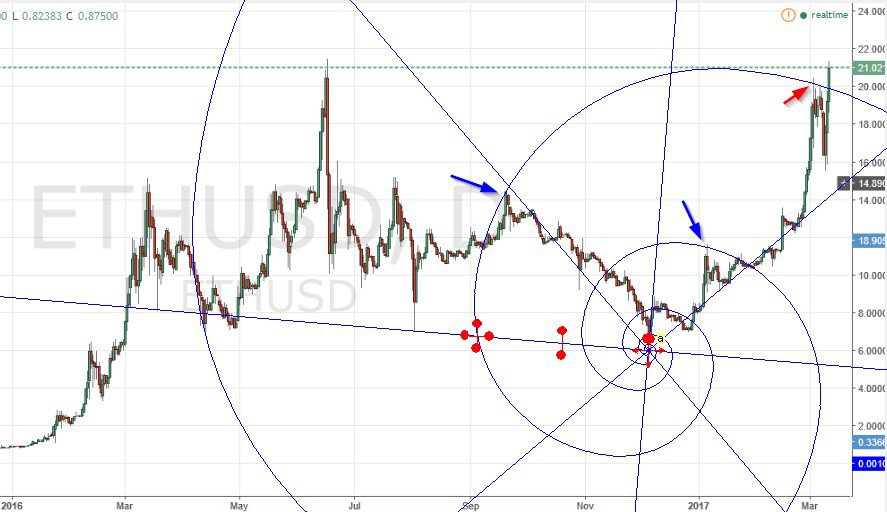
This Fibonacci Vortex (developed by Erik Beann) correctly forecasted the resistance at $13.5, and again more recently at $20. As you can see, price has broken through the resistance pretty hard. Barring an unexpected reversal later in the day with a close back below resistance, the next resistance shown on this setup is quite a bit higher.

A long-term Andrew’s Pitchfork correctly forecasted several recent support and resistance points in the current rally, as marked by the red arrows. What is more interesting is that the area highlighted in yellow marks forecasted support from the recent swing low. This point was clearly identified as a buying area.
But it is the green highlighted area that is the most interesting, in my opinion. The “0 line” which caused so much problems (as expected) has yielded to buying pressure. This is not trivial. Indeed it is a buying signal on the daily chart.

A rather successful trader of yesteryear by the name of George Bayer made his fortune with the use of ellipses. My (rather rudimentary) understanding of his work is reflected in the picture above.
In this case, the ellipse shown above shows many places, highlighted with arrows, where significant S/R was forecasted by the ellipse. Whether it will continue to do so remains to be seen of course. However, it is worth noting that the top of the ellipse is $35, which happens to be in the same ballpark as the possible target area we identified in a recent column.
Suffice to say, we have seen more than enough to recognize that ETH is a market to watch and trade at this time.
Bitcoin
Bitcoin has seen some wild fluctuations in the past couple weeks. No doubt this was due in part to the anticipated launch (and then rejection of) a Bitcoin ETF. I for one am very happy to hear that the ETF was rejected. In my opinion the existence of such a publically traded entity might have given the FED a narrow window through which they could exercise a degree of regulation over the cryptocurrency space, and that would have been a terrible development. (See here for more on that topic.)
In addition, wall street would have used such an ETF as a vehicle through which they would have been able to use fiat currency to (naked) short sell Bitcoin. As the powers-that-be have the ability to create fiat out of thin air, they would for the first time be able to have a cost-free means to disrupt the cryptocurrency space. Of course, malevolent actors such as those found on wall street routinely disrupt the crypto markets already; but they can not do so without cost, as they must either mine, or buy the coins first.
It can be argued that they can already buy the coins without cost , since they create fiat out of thin air. That is arguably true, but the problem for them is when they buy the coins in bulk, they drive the remaining coins value ever higher. This inadvertently destroys the illusion that the coins are not a good investment. A classic catch-22. Regardless, I am happy that the ETF failed, though I’m sure opinions differ on this point.
Utilizing the Fibonacci Vortex again, we can see that the huge selloff in bitcoin few days back came exactly at forecasted resistance.

The red arrows all mark where significant S/R was forecasted in the past, and the big blue arrow at the top shows where the selloff hit the vortex a few days ago. I’m sure there are many traders who bought the top who wished they had seen this picture LAST week…
This picture is decidedly bearish. Before seeing this picture I was inclined to think we are looking at a good short-term buying opportunity at present levels. Now I am not so sure. I think I will pass on this trade and stay focused on ETH.
Remember: The author is a trader who is subject to all manner of error in judgement. Do your own research, and be prepared to take full responsibility for your own trades.


