
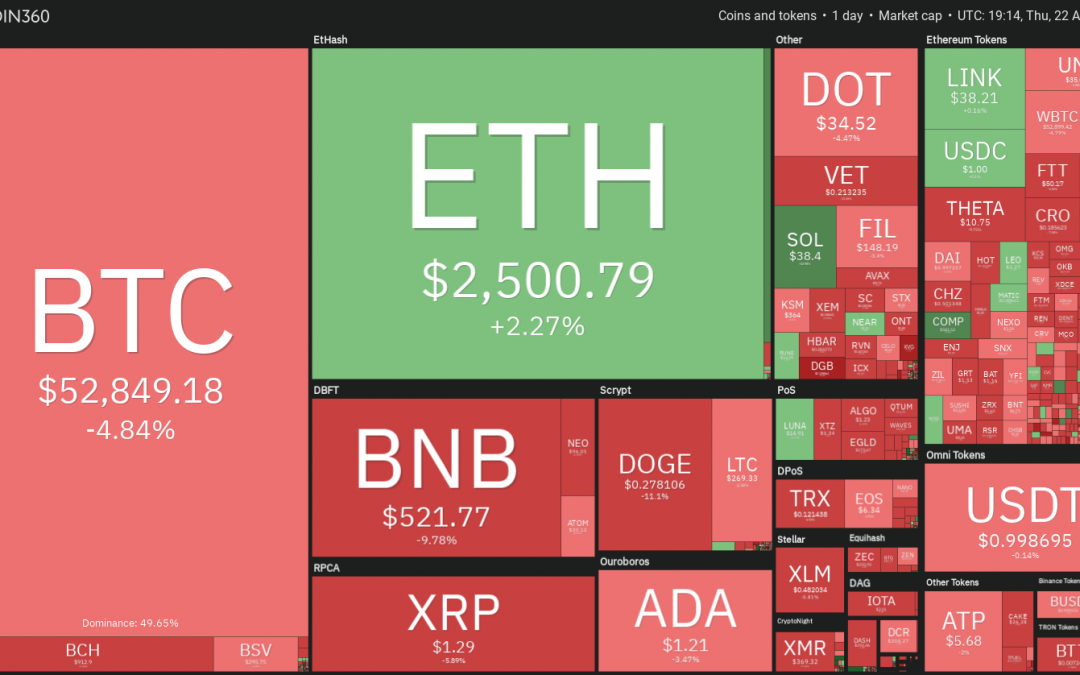
Bitcoin’s (BTC) recent downturn temporarily pulled its dominance rate down to 49.5% which is the lowest level since August 2018. This has led a growing number of traders to predict that altcoins will outperform Bitcoin in the short term.
Over the past few months, the price action from altcoins seems to be disengaging from Bitcoin. Take for example, Ether (ETH), which hit a new all-time high today even as Bitcoin price is down 20% from its all-time high.
The major factor that could have tilted the scale in favor of altcoins is the massive rise in the popularity of the decentralized finance space. New York Stock Exchange president Thomas Farley pointed out in an interview with CNBC that “DeFi exchanges are doing as much volume if not more than Coinbase today.”
Let’s look at the fundamentals and technicals of three tokens that have been on the rise in the past few months.
LINK/USDT
Chainlink (LINK) is one of the most popular decentralized oracle solutions. To support the rapid pace of innovation in the crypto industry, Chainlink outlined its vision for the future in its new whitepaper dubbed Chainlink 2.0 on April 15.
The whitepaper presents a new architecture for building hybrid smart contracts where second-layer networks called Decentralized Oracle Networks store and compute the data off-chain before feeding the input on the blockchain. This new concept could empower developers to build hybrid smart contracts quickly, similar to application programming interfaces (APIs) that developers build in the web world.
Another positive for LINK investors came as Grayscale announced the addition of the altcoin to its Digital Large Cap Fund on April 6. Although the allocation is only 0.87%, the inclusion could bring it into the focus of institutional investors.
On April 2 Polkadot and Chainlink announced that Chainlink’s price feeds woul be available as Substrate oracle pallet, enabling projects in the Polkadot ecosystem to integrate Chainlink oracles through a simplified library.
LINK is currently correcting from its sharp rise from $23.61 on March 24 to the all-time high at $44.33 on April 15. Although the price plunged below the moving averages on April 18, the bulls aggressively bought at lower levels as seen from the long tail on the day’s candlestick.

Since then, the bears and the bulls have been battling it out at the 20-day exponential moving average ($35.89). The bulls are attempting to defend the 20-day EMA support and launch the next leg of the up-move while the bears are trying to extend the correction by breaking the support.
The marginally rising 20-day EMA and the relative strength index (RSI) above 57 indicate a minor advantage to the buyers. If the bulls can push and sustain the price above $40, the LINK/USDT pair could retest $44.33. A breakout of this resistance could start the next leg of the uptrend, which could reach $50 and then $55.72.
This bullish view will invalidate if the bears sink and sustain the price below the 20-day EMA. Such a move could pull the price down to the 50-day simple moving average ($31.42) and delay the start of the next leg of the uptrend.
BAND/USDT
Band Protocol (BAND) was featured by Cointelegraph on Feb. 2 when its price was at $11.14. Since then the price h rallied to an all-time high at $23.30 on April 15, a gain of 109% in about two and half months.
The protocol announced on April 15 that its oracle data is live on Google Cloud Public Data, which can be used to build traditional, hybrid blockchain and cloud applications. Band said that the integration into Google Cloud Public Data was the first among many use-cases being explored with partners “to bridge traditional enterprises and blockchain applications.”
Band has continued to build partnerships to increase its market share. In the past month, it has announced partnerships with Krystal, Equilibrium, and Polygon. Additionally, one of the biggest financial institutions in Thailand, SCB 10X partnered with Band as a node validator.
BAND is currently trading inside a large range between $11.50 and $20.62. The bulls had pushed the price above the overhead resistance of the range on April 15 and 16 but they could not build up on the breakout.

This suggests that bears are active at higher levels. The sellers pulled the price back into the range on April 17, trapping the aggressive bulls. Long liquidations could be one of the reasons for the sharp fall on April 18 that momentarily dropped below the $11.50 support.
However, the positive sign was that the bulls aggressively bought the dips on April 18 as seen from the long tail on the candlestick.
After staying between both moving averages for the past three days, the BAND/USDT pair has broken above the 20-day EMA ($17.04) today. The pair could once again move up to $20.62 where the bears are again likely to mount a stiff resistance.
The flat moving averages and the RSI just above the midpoint suggest that the range-bound action may continue for a few more days. A breakout and close above $21 could open the gates for the resumption of the uptrend. The next target on the upside could be $29.74.
QTUM/USDT
Qtum (QTUM) was covered by Cointelegraph on Feb. 11 when its price was at $7.59. The token took off and made an all-time high at $20.72 on April 19, rallying 173% in just over two months.
The most eagerly awaited development is the transition from 128-second block average to 32-second block average that is expected to take place via a hard fork on April 30.
On March 31 Qtum founder Patrick Dai said that the protocol was working to enable smart contracts for Filecoin through the Qtum network. On the same day, Dai teased that non-fungible tokens are also making their way on Qtum.
QTUM’s Doji candlestick pattern on April 19 indicated that the uptrend could be losing steam. The short-term weakness was confirmed further when the price continued lower on April 20.

The bulls are currently attempting to defend the 20-day EMA ($15.08). A strong bounce off this support will indicate that the sentiment remains positive and the bulls are accumulating on dips.
The buyers will likely try to push the price to $18.63 and then $20.72. A breakout of this resistance will signal the resumption of the uptrend.
However, the negative divergence on the RSI suggests the momentum may be weakening. If the bears sink the price below the 20-day EMA, the QTUM/USDT pair could slump to the 50-day SMA ($10.47) where the buyers may step in to stall the decline.
A strong rebound off the 50-day SMA could keep the pair range-bound for a few days while a break below the support will suggest the bears are back in the game.
The views and opinions expressed here are solely those of the author and do not necessarily reflect the views of Cointelegraph. Every investment and trading move involves risk, you should conduct your own research when making a decision.