In the world of crypto trading, recognizing patterns can yield more than insights.
In fact, this skill is what traders use to determine the strength of a current trend during key market movements and to assess opportunities for entries and exits. In short, patterns can be useful in determining which direction price is likely to go.
Further, they can help distinguish between what is real and what is false when a break occurs, by using certain formations to dismiss particular price movements. However, you should dedicate a decent amount of time in getting to know particular patterns that form during different time frames around the particular asset you are interested in.
The better you become at spotting these patterns, the more accurate your trades develop, with the added ability to dismiss false breakouts as they appear.
Below are three examples to help you along your journey to mastering the charts:
1. Head and Shoulders
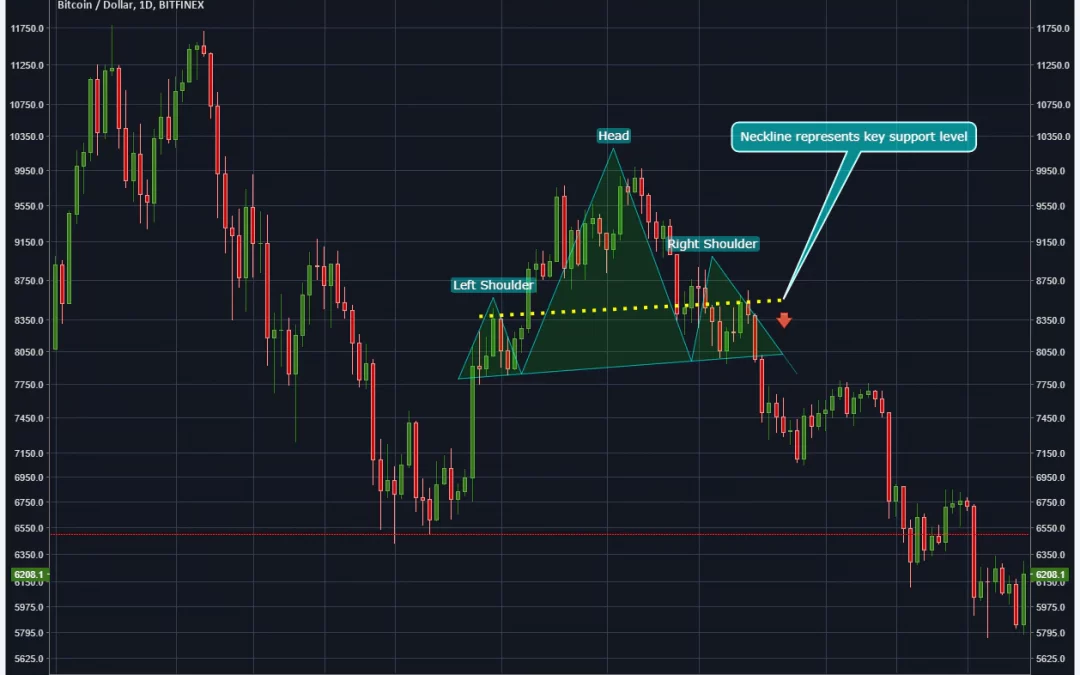
The infamous head-and-shoulders pattern is a bearish reversal pattern that signals to traders that there’s been a particular change in the current trend.
Identified by its three peaks (with the highest peak as the “head” and the other two peaks representing the “shoulders”) the pattern also features a “neckline” or “trendline” that is drawn between the two shoulders (at the top of their respective peaks) showing the key support level you should look out for in case of breakdown.
If prices pass below the neckline and continues to fall, it is likely you are staring at a head-and-shoulders pattern completing its formation and bucking any current bullish trend.
Generally, the price is likely to break down further, once the pattern has been completed.
The head-and-shoulders pattern usually provides the strongest confirmation on the daily or intraday 4-hour charts as smaller time frames offer up less conviction.
The cup-and-handle pattern is a bullish continuation sign identified by a “bowl” or “half round” cup that forms the basis of the pattern with relatively equal highs on either side of the edges.
The handle should resemble a bull flag, in which the price appears to be heading in the opposite direction of the current trend. This is usually followed by continuation and a breakout from the bottom of the handle.
While cup-and-handle pattern formations are rare, they are best identified on the daily chart as this avoids possible confusion with intraday cup-and-handles that offer less conviction than their longer-term cousins.

The double-top pattern is one of the most recognizable and common charting patterns traders use to determine a change in a current trend.
The pattern forms when the price attempts to test a particular resistance level and gets rejected, then goes on to trade sideways for a bit before attempting yet another rally to the same resistance level whereby it is rejected a second time, sending prices into a deeper recession.
The pattern usually indicates a reversal in the current trend over a much longer period where traders can expect prices to continue to fall.
Double tops function over most time frames, however, they are best viewed and confirmed on the daily or weekly chart as well as the higher intraday charts such as the four or eight hour.

Remember, patterns are best used in conjunction with other indicators to add layers of confirmation to your analysis.
They are a formidable tool to add to your trader’s kit so use them wisely and knuckle down for a hard study. Indeed, charting patterns are generally best used in conjunction with other technical tools such as the Stochastic Oscillator to help judge the momentum of a trend and candlestick analysis to determine an assets current price action.
Wallpaper image via Shutterstock; Charts via TradingView


