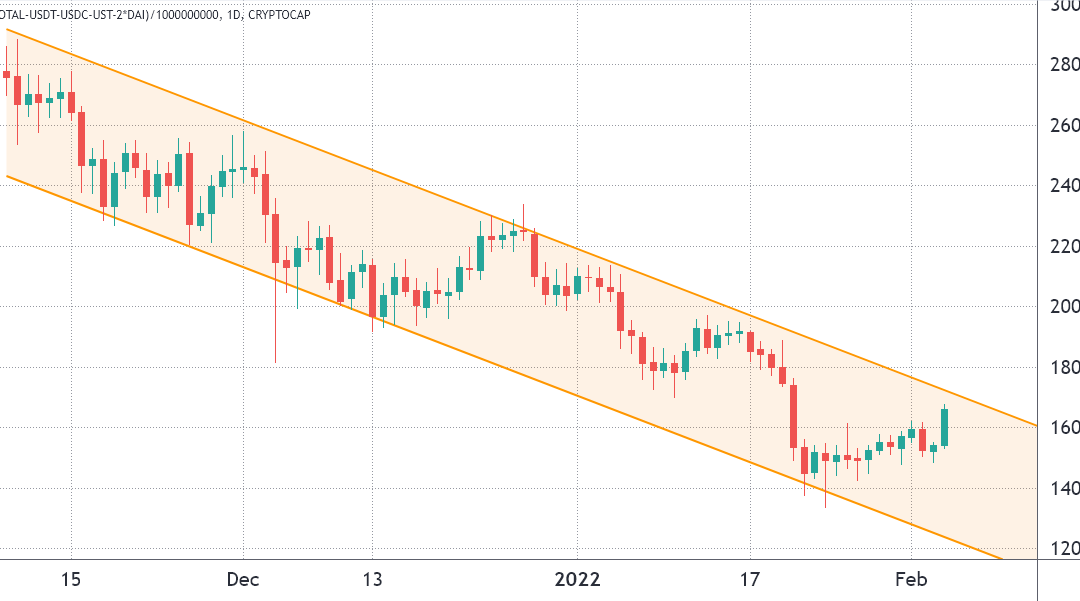
This week the total crypto market capitalization rallied 10% to $1.68 trillion, which is a 25% recovery from the Jan. 24 bottom. It’s too early to suggest that the market has found a bottom but two key indicators — The Tether/CNY premium and CME futures basis — have recently flipped bullish, signaling that positive investor sentiment is backing the current price recovery.
Traders should not assume that the bear trend has ended by merely looking at price charts. For example, between Dec. 13 and Dec. 27, the sector’s total market capitalization bounced from a $1.9 trillion low to $2.33 trillion. Yet, the 22.9% recovery was completely erased within nine days as crypto markets tanked on Jan. 5.
Bearish data suggests the Fed has less room for rate hikes
Even with the current trend change, bears have reason to believe that the 3-month long descending channel formation has not been broken. For example, the Feb.4 rally could have reflected the recent negative macroeconomic data, including EuroZone retail sales 2% yearly growth in December, which was well below the 5.1% market expectation.
Independent market analyst Lyn Alden recently suggested that the United States Federal Reserve could postpone interest rate hikes after disappointing U.S. employment data was released on Feb. 2. The ADP Research Institute also showed a contraction of 301,000 private-sector jobs in December, which is the worst figure since March 2020.
Regardless of the reason for Bitcoin (BTC) and Ether (ETH) gaining 10% on Friday, the Tether (USDT) premium at OKX reached its highest level in four months. The indicator compares China-based peer-to-peer (P2P) trades and the official U.S. dollar currency.

Excessive cryptocurrency demand tends to pressure the indicator above fair value, or 100%. On the other hand, bearish markets tend to flood Tether’s market, causing a 4% or higher discount. Therefore, Friday’s pump had a significant impact on China-driven crypto markets.
CME futures traders are no longer bearish
To further prove that the crypto market structure has improved, traders should analyze the CME’s Bitcoin futures contracts premium. The metric compares longer-term futures contracts and the traditional spot market price.
It is an alarming red flag whenever that indicator fades or turns negative (backwardation) because it indicates that bearish sentiment is present.
These fixed-calendar contracts usually trade at a slight premium, indicating that sellers are requesting more money to withhold settlement for longer. As a result, the 1-month futures should trade at a 0.5% to 1% annualized premium in healthy markets, a situation known as contango.

The chart above shows how the indicator entered backwardation levels on Jan. 4 as Bitcoin moved below $46,000 and Friday’s move marks the first sentiment trend reversal in a month.
Data shows that institutional traders remain below the “neutral” threshold as measured by the futures’ basis, but at least reject the bearish market structure formation.
While the CNY/Tether premium might have shown a trend shift, the CME premium reminds us that there’s a lot of distrust in Bitcoin’s capacity to function as an inflationary hedge. Still, the lack of CME traders’ excitement could be exactly what BTC needs to further fuel the rally if the $42,000 resistance is broken over the weekend.
The views and opinions expressed here are solely those of the author and do not necessarily reflect the views of Cointelegraph. Every investment and trading move involves risk. You should conduct your own research when making a decision.


