ChainLink traded at around $17.00 on Tuesday, September 1
The price of ChainLink has declined 4.15% in the past 24 hours and is trading around $15.50 as of writing; this after it rallied 3% to highs of $17.00 on Monday
LINK/USD is likely to continue on the downside after breaking a Symmetrical Triangle pattern. According to one analyst, the price of the popular coin could correct almost 50% to lows of $8.00 if support levels at current prices do not hold.
ChainLink price signals
ChainLink rose to a high of $20 in mid-August, thanks to a parabolic rally that saw it become the 5th largest cryptocurrency by market cap.
Although the price has since corrected lower in the past seven days, the token still holds an overall bullish bias over higher time frames. At current levels above $15.00, LINK/USD is more than 100% up on its price at the end of July when it traded around $7.20.
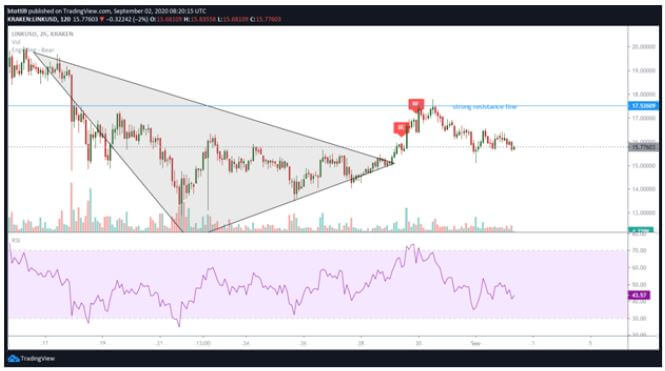
The LINK/USD pair broke out of a symmetrical triangle in rallying to highs of $17.00 on September 1. However, the bullish momentum is likely not to hold as prices have dipped at the 50-day and 200-day moving averages on lower timeframes.
Also, bulls may have to contend with a bearish divergence as shown on the 2-hour charts. ChainLink has printed two bearish engulfing patterns, and bulls might struggle to break above a major resistance line around $17.55.
As of writing, ChainLink is changing hands around $15.69 to the US dollar and bulls must aim at $16.50 on the daily close to retain the upper hand.
A strong price rejection at the level would invite selling pressure, which coupled with indecisiveness for the rest of the market, could see LINK/USD fall to lows of $12-$14.50.a breakdown at these support zones means the next major support area is around $8.00, which formed as the price rose from lows of $7.20 to highs of $15.
The RSI is firmly held in bearish territory although there is a hint of a divergence on the 2-hour chart. If bulls hold $15.50, an upside in the short term could take the price back above $17.00 and open up a route to a revisit of an all-time high price level at $20.
However, what might dent bulls’ chances is the weakening trading volume recorded over the past 24 hours.
The post ChainLink (LINK) flashes red pattern breakout appeared first on Coin Journal.


