- Cardano price is up 0.5% over the past 24 hours, trading around $0.60.
- The technical picture has ADA trading within a broadening wedge, with a potential retest of the lower trendline.
- Technical indicators like the MACD and RSI indicate sustained bearish momentum.
Cardano (ADA) is just in the green on the day, up about 0.5% in the past 24 hours at the time of writing and risking fresh losses.
Bitcoin’s surge to above $106 has bulls eyeing more upside, and Cardano could ride the broader uptick to snap its bearish daily close streak.
However, with ADA trending in a broadening wedge, a potential retest of the lower trendline suggests buyers may yet hit the rocks.
Cardano price today
Cardano has faced significant volatility over the past month. Having reached highs of $0.84 in late May, the past week has seen it extend losses to nearly 20% over the month and 5% this past week.
This has come amid a broader risk asset sell-off, catalyzed by escalating Middle East tensions.
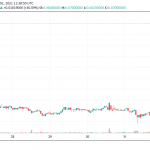
Currently, the $0.60 level is acting as a near-term support, aligning with a trendline formed since December 2023.
A failure to hold $0.60 could precipitate a retest of $0.50 or lower, particularly as on-chain data indicates rising selling pressure from long-term holders.
ADA price technical outlook
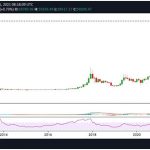
From a technical perspective, ADA is confined within a broadening wedge pattern, characterized by diverging trendlines that suggest increasing volatility.
This pattern implies a potential retest of the lower trendline, which could drive prices toward $0.40 if bearish momentum persists.
Notably, the MACD on the weekly chart shows a bearish crossover, with the MACD line below the signal line, reinforcing downside pressure.

Similarly, the RSI, currently at 44, is below the neutral 50 level and trending downward.
This indicates fading bullish conviction and room for further declines before reaching oversold territory.
These indicators collectively warn of a bearish outlook in the short term.
However, a bullish reversal remains plausible if ADA breaks above the upper wedge boundary of the recently formed pattern.
Such a breakout could catalyze a significant rally, potentially exceeding +380% and targeting levels above $1.6 to $2.00.
This price forecast aligns with historical price cycles and optimistic market conditions.
In the short term, key resistance lies at $0.80 and $1.14, potentially paving the way for$1.5 or higher.
Analysts see the interplay of whale accumulation, with millions of ADA acquired recently, and potential catalysts like an ADA ETF approval bolstering bullish sentiment.
Nevertheless, broader market weakness and profit taking could derail bulls.
In this case, a breakdown below $0.60 could bring $0.40 into play.


