According to the creator of the analytical bitcoin data web portal, Look Into Bitcoin, a chart often referred to as ‘Hodl Waves’ shows a bull run could be imminent. The web portal’s analyst Phillip Swift recently tweeted that 60% of all the bitcoin in circulation hasn’t moved in twelve months. The last time this trend took place was in 2016, months before the start of the 2017 crypto bull run.
60% of Bitcoin’s Supply Hasn’t Moved in Over a Year
Last March, news.Bitcoin.com reported on a research report authored by Coin Metrics analyst Jacob Franek, which said as of March 1, 2020, roughly 42% of all BTC has not moved onchain in more than two years. However, since then on March 12, 2020, otherwise known as ‘Black Thursday,’ the price per BTC dropped to $3,600 per coin. Using today’s exchange rates, BTC has risen 154% since Black Thursday and is currently trading above $9,100 per unit. The study from Coin Metrics highlighted that “Hodl Waves” have grown larger during the last few months. Essentially, Hodl Waves data analyzes the Bitcoin network’s UTXOs over the course of a few years and people like to measure distinct holding periods.
Phillip Swift, the founder of the BTC monitoring web portal Look Into Bitcoin has noted that 60% of the bitcoin supply in circulation has not moved in over a year. Swift tweeted that this typically signals a trend toward the beginning of a bull run, as it did in late 2016 and into 2017. Swift stated:
60% of all bitcoin has not moved on the blockchain for at least 1 year. This is an indication of significant hodl’ing. The last time this happened was in early 2016, at the start of the bull run.

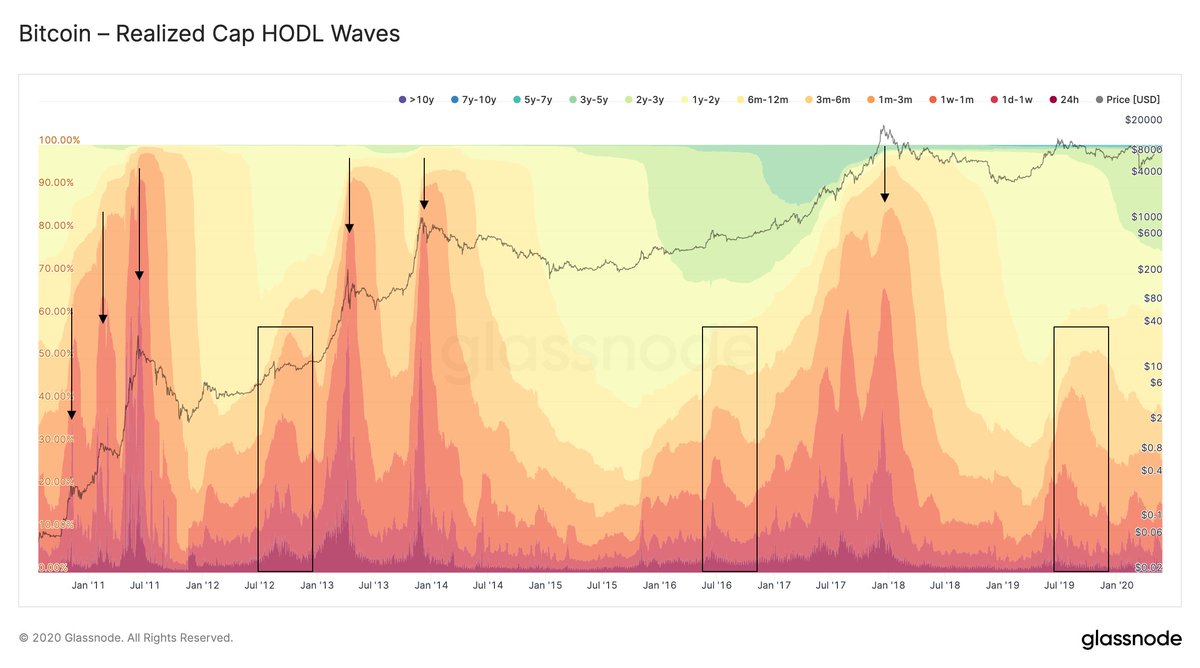
Glassnode: ‘Realized Cap Age Bands Help Navigate Bitcoin Cycles’
Swift’s findings and the Hodl Waves chart he shared, shows that the 60 percentile has held steady for close to six months. Some traders have said that Goldman Sachs and Hedge fund manager and investor, Paul Tudor Jones’s statements have made crypto investors more bullish.
“It is the likes of Tudor and Goldman that can help drive the next big wave of inflows into crypto,” explained one individual on Twitter. “Not the unicellular bitcoin Twiteratti with their stack sats and hodl mantras — Hence why it is important to pay attention to what they say,” he added.

On May 26, news.Bitcoin.com also reported on the data firm Glassnode’s outlook, which noted that BTC was seeing some declining market health. 17 hours ago after Phillip Swift’s Hodl Waves tweet, Glassnode tweeted about a chart that shows BTC’s “realized cap Hodl Waves.”
“Instead of using Bitcoin supply by age, UTXOs in each band are weighted by their creation price,” Glassnode tweeted. “The resulting realized cap age bands help navigate BTC cycles, gauge market tops, and the start of bull markets.”
What do you think about the Hodl Waves charts and theories? Let us know what you think in the comments below.
The post Bull Run Imminent? Hodl Waves Chart Shows 60% of Bitcoin Hasn’t Moved in a Year appeared first on Bitcoin News.


