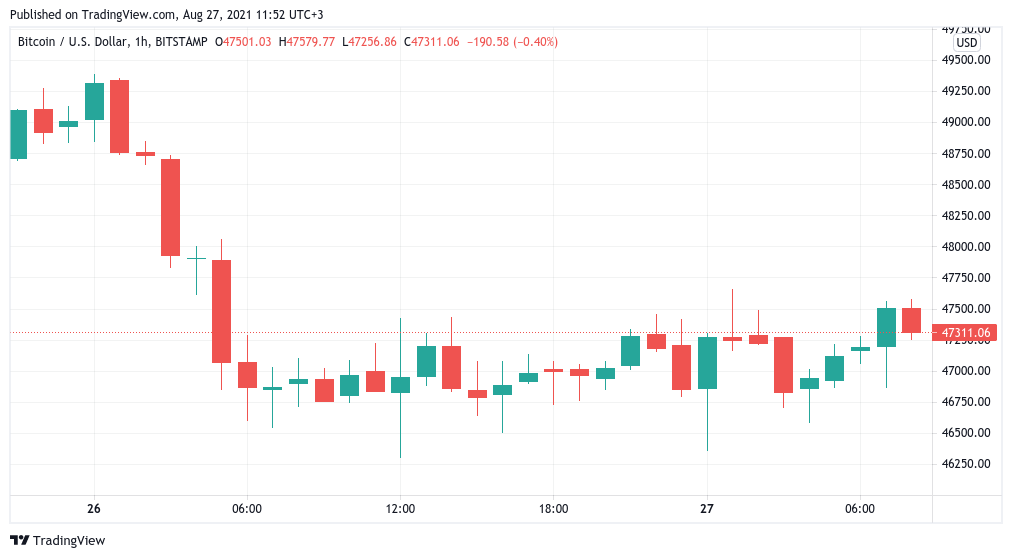
Bitcoin (BTC) hovered near $47,000 on Friday as traders took no chances on the day of the United States Federal Reserve’s Jackson Hole summit.
End-of-month cold feet for Bitcoin traders
Data from Cointelegraph Markets Pro and TradingView showed BTC/USD fluctuating in a range centered on $47,000 during Friday.
The past 24 hours saw little action up or down for Bitcoin as market participants awaited cues from both the Fed and the end-of-month options expiry event, this time worth some $2 billion.
“Not a very strong reaction at the moment,” trader and analyst Rekt Capital commented on price action overnight.
“A Daily Close above the high-$47000s would be a positive sign of strength however.”
In the event, a higher close failed to materialize, with $50,000 still remaining unchallenged after Bitcoin lost the level earlier in the week.
Cointelegraph contributor Michaël van de Poppe likewise stuck to his previous forecasts, these involving a BTC support zone around $44,000.
“This idea on Bitcoin is still my primary vision,” he tweeted.
Options expiries tend to generate more fear than genuine selling pressure, with BTC price action often shrugging off the events themselves. Open interest totaled $9.19 billion Friday, a three-month high.

Buzzword: “tapering”
As Cointelegraph reported, the Fed’s virtual Jackson Hole event is tipped to shed light on future economic policy changes tied to the coronavirus pandemic.
Related: Analysts say Bitcoin price pullback and profit-taking at $50K ‘was expected’
Asset purchases may be scaled back, a mechanism known as tapering, in what could change the mood among traditional assets as the S&P 500 trades at all-time highs.
Any hints about inflation policy may also serve to boost alternative asset demand. The U.S. dollar gained in the run-up to the Fed’s debut, traditionally a point of friction for Bitcoin.


