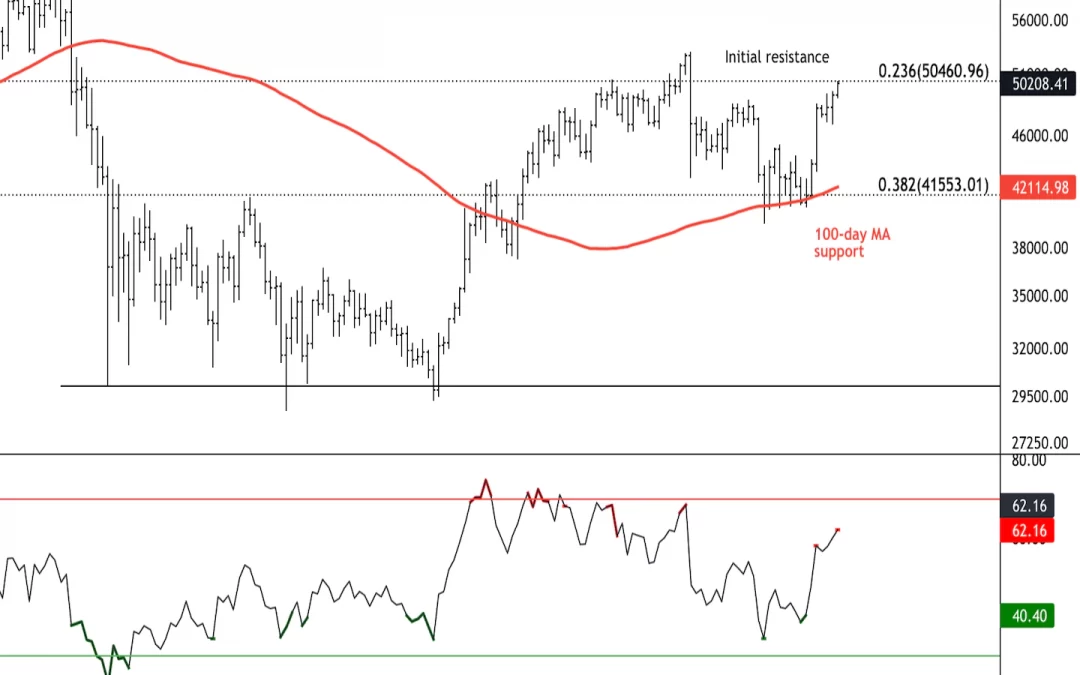
Bitcoin (BTC) is trading around $50,000 for the first time since early September as short-term momentum improves. The cryptocurrency has broken above a series of lower price highs last month and indicators suggest continued upside, initially toward the $52,000-$55,000 resistance range.
The sell-off last month was limited to the 100-day moving average around $40,000, which is also where a breakout occurred on August 6. Buyers gathered strength as price consolidated for several days, which preceded a fresh breakout above $46,000 last week.
- The relative strength index (RSI) on the daily chart is not yet overbought, suggesting short-term buyers could remain active toward upper resistance levels.
- A decisive breakout above $50,000 could yield further upside toward the all-time high near $60,000, although buyers could start to take profits ahead of that level given slowing momentum on the weekly chart.
- For now, the intermediate-term trend is improving with limited corrections and rising support levels.


